Working with RealTime Monitoring, Daily Checks, Performance Data and CCMS Alerts
This chapter describes how to work with the Monitoring Results in Avantra.
Working with RealTime Monitoring Results
There are several way to access RealTime Monitoring results using Avantra UI.
Viewing RealTime Monitoring Results
There are several options to access RealTime Monitoring Check Results once your logged into Avantra UI:
-
Select from the top-level menu.
There is one line per defined Customer, each containing columns for the number of Systems, Checks and Business Services in the different check status.
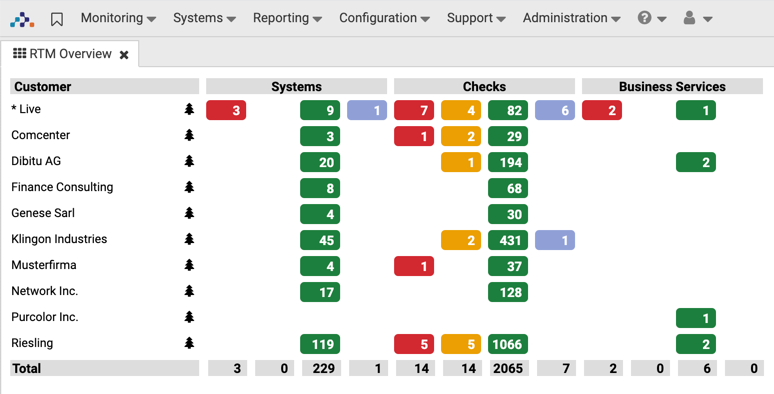
You can click into every inner cell of this table (including the ones of the Total line), except it is empty or
0:-
Entries in the Critical and Warning column each open a list of Critical and Warning Systems / RealTime Monitoring Checks / Business Service for the corresponding Customer (or for all Customers, if you click in the Total line).
-
Entries in the Ok column open a list of Critical, Warning, and Ok Systems / RealTime Monitoring Checks / Business Service for the corresponding Customer (or for all Customers, if you click in the Total line).
-
Entries in the Unknown column open a list of Unknown and Disabled Systems / RealTime Monitoring Checks / Business Service for the corresponding Customer (or for all Customers, if you click in the Total line)
-
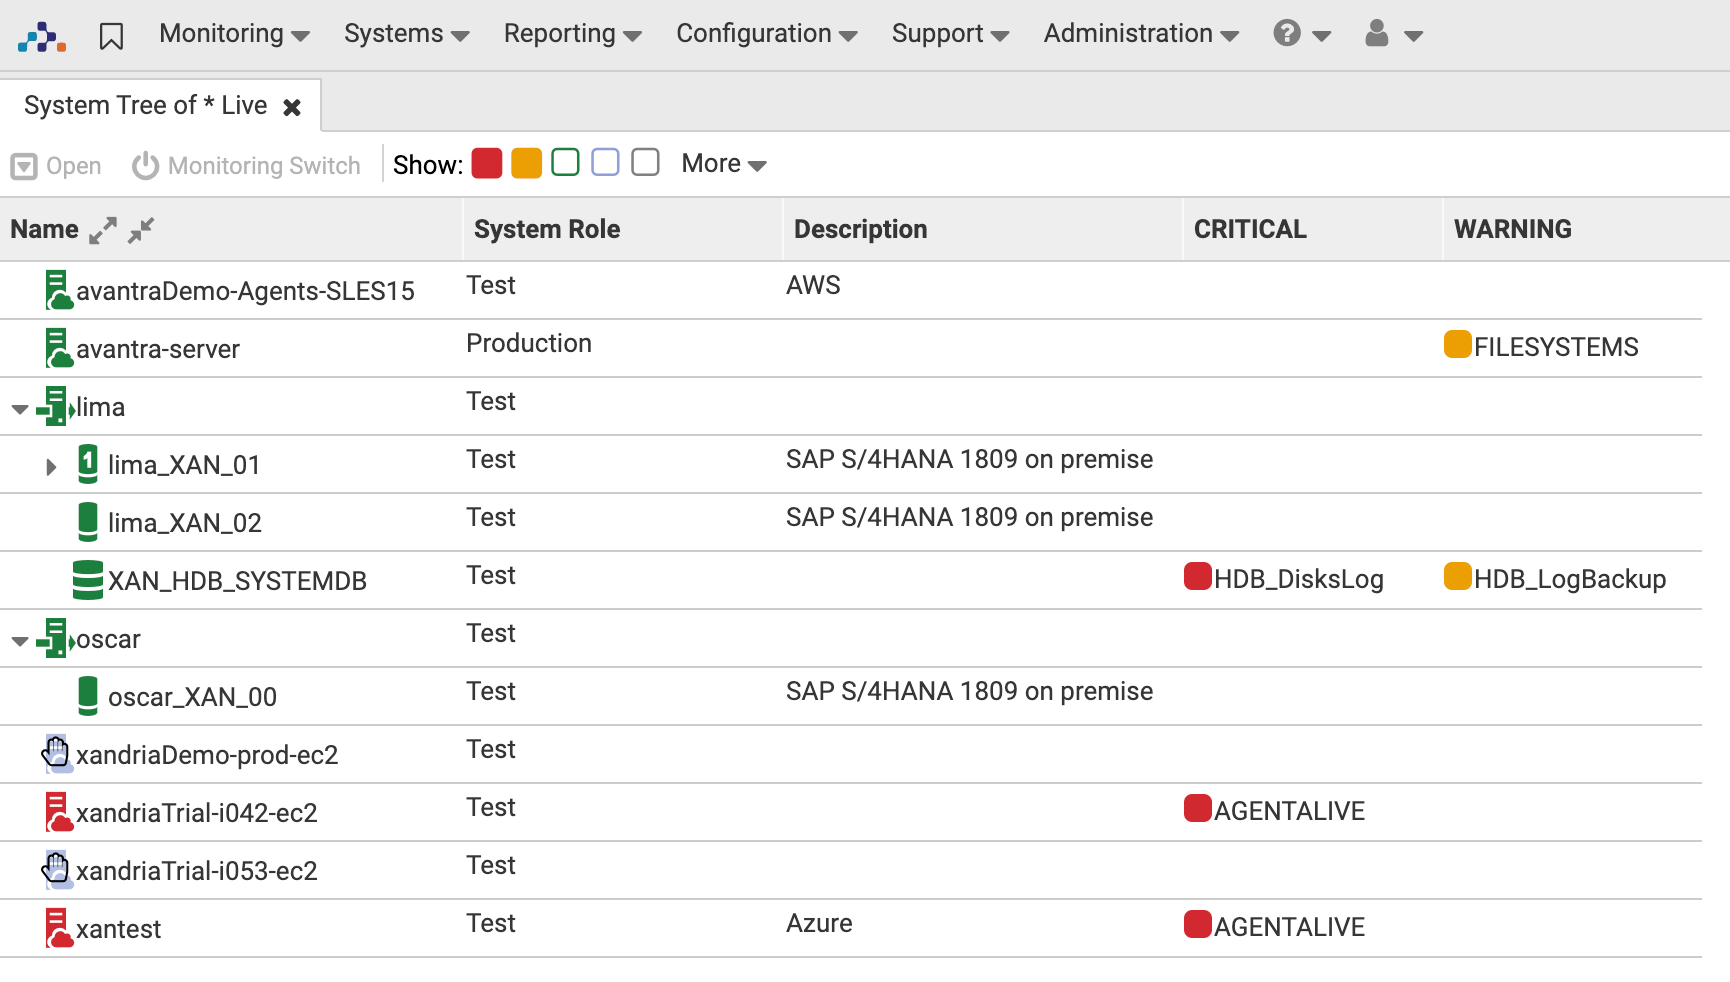
If you click on the icon the System Tree will open showing the System Status of each System together with the Critical and Warning check status:
-
-
Select from the top-level menu. This page displays a list of all Check Results with check status Critical or Warning.
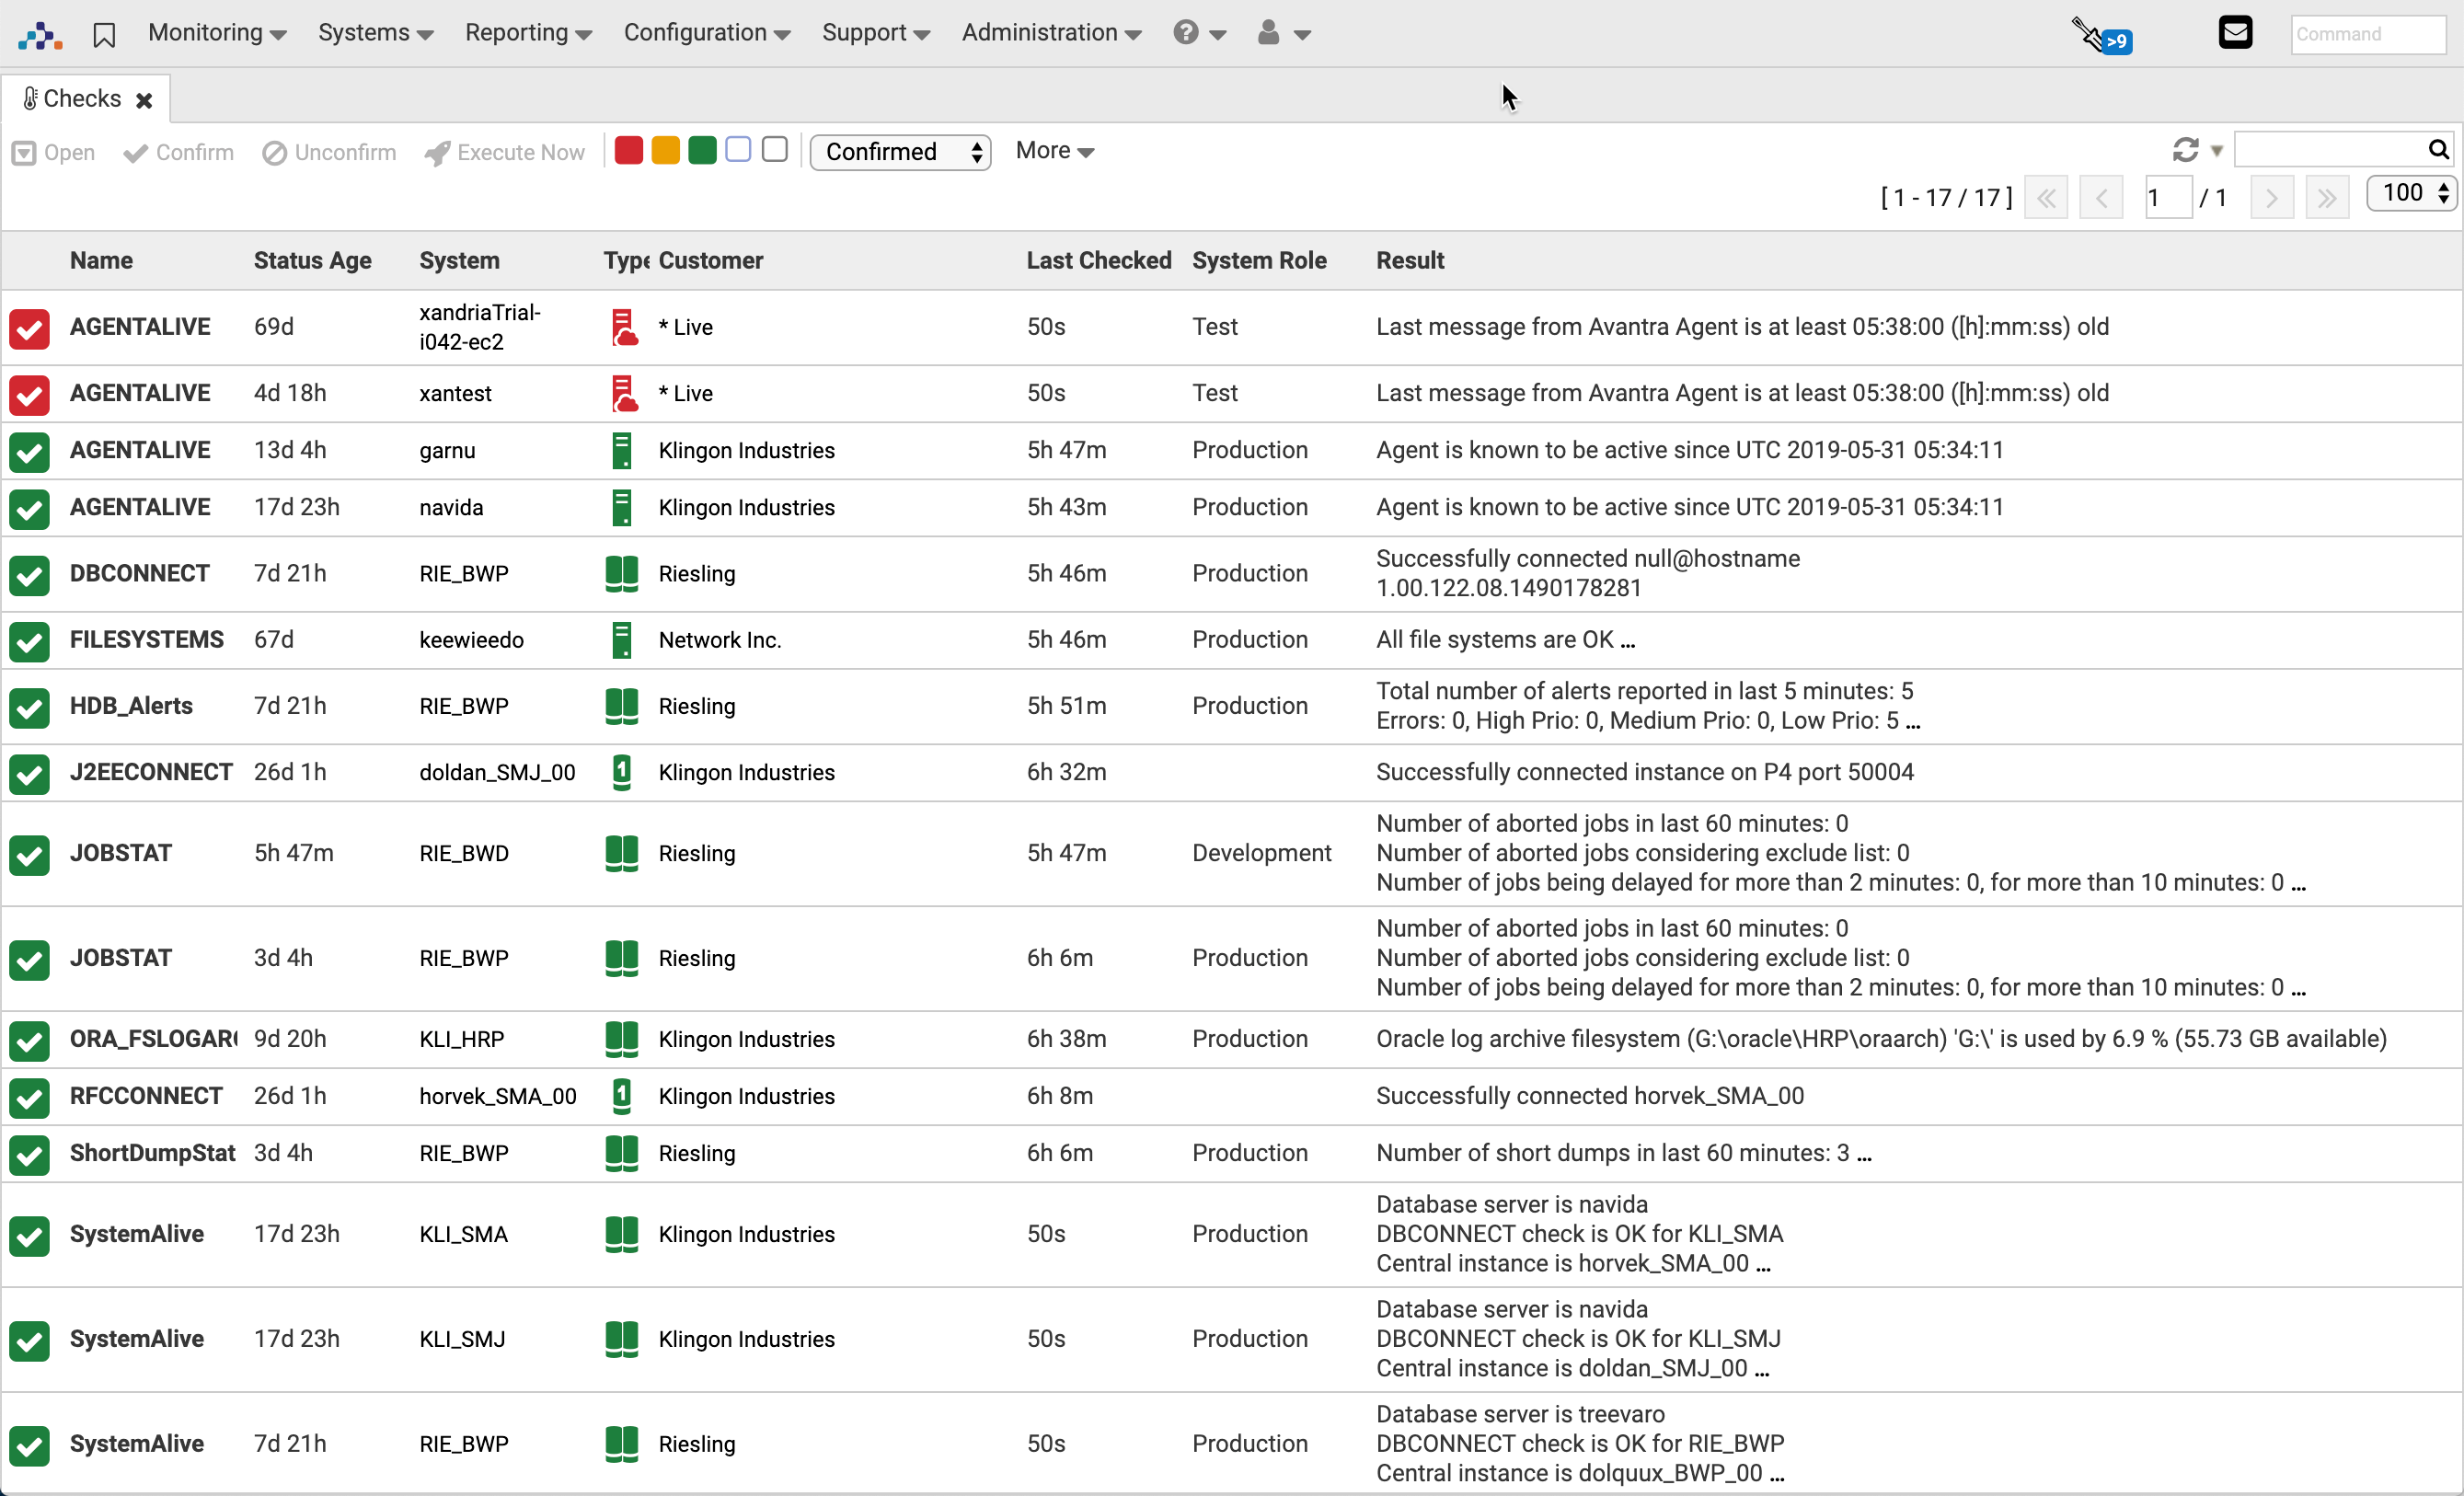
From the Refresh dropdown, you can select the refresh interval. Or you can turn automatic refreshing on or off.
You may use the check status icons in the tab menu to toggle the view of each of the check status. For Systems you can additionally toggle the System Type, and you can restrict the list to operational Systems or to Systems having monitoring turned on (or off).
For RealTime Monitoring Checks you can restrict the view to confirmed or unconfirmed Checks as well.
You need the permission View RTM in order to view RealTime Monitoring results.
|
You can also view RealTime Monitoring Check Results using XanMobile. |
Confirming RealTime Monitoring Checks
In order to confirm a RealTime Monitoring Check, proceed to the Check List page as described in Viewing RealTime Monitoring Results and perform the following steps:
-
Select one or more entries and push the Confirm button.
-
Fill in a confirmation message in Message.
-
If you want this Check to stay confirmed until the next check status change occurs, select None for Confirmation Auto Reset. Otherwise select either a Date/Time the Check will be unconfirmed automatically, or a Period after which it will be unconfirmed.
Please note that the confirmation is cleared in any case if the check status changes. -
Push the OK button.
You need the permission Confirm RTM in order to confirm RealTime Monitoring Checks.
Viewing RealTime Monitoring History
In order to view the history of a particular RealTime Monitoring Check proceed as follows:
-
Proceed to the Check List page as described in Viewing RealTime Monitoring Results. Select an entry from the list and push the Open button.
-
Switch to the History tab.
The most recent record appears on top of the list.
A new entry is created either when the check status changes or a confirmation/un-confirmation occurs but not when the check message changes only. Consequently the column Result contains the value of the check message at the time the check status has changed. It does not show the most current result.
Confirmation and un-confirmation events are tracked and kept together with the confirmation message in Confirmed by and Confirmation Message.
You need the Permission View RTM in order to view RealTime Monitoring history.
RealTime Monitoring "Control Center" View
The RealTime Monitoring"Control Center" view comprises a summary of the most important Avantra events.
You can access the "Control Center" via .
This view is literally a pre-defined Dashboard.
You can also access this page directly using URL http[s]://[avantra-server][:port]/xn/dashboard/RTM%20Control%20Center. Set the rtmuser property for a configuration option without login.
The "Control Center" view will look like shown below:
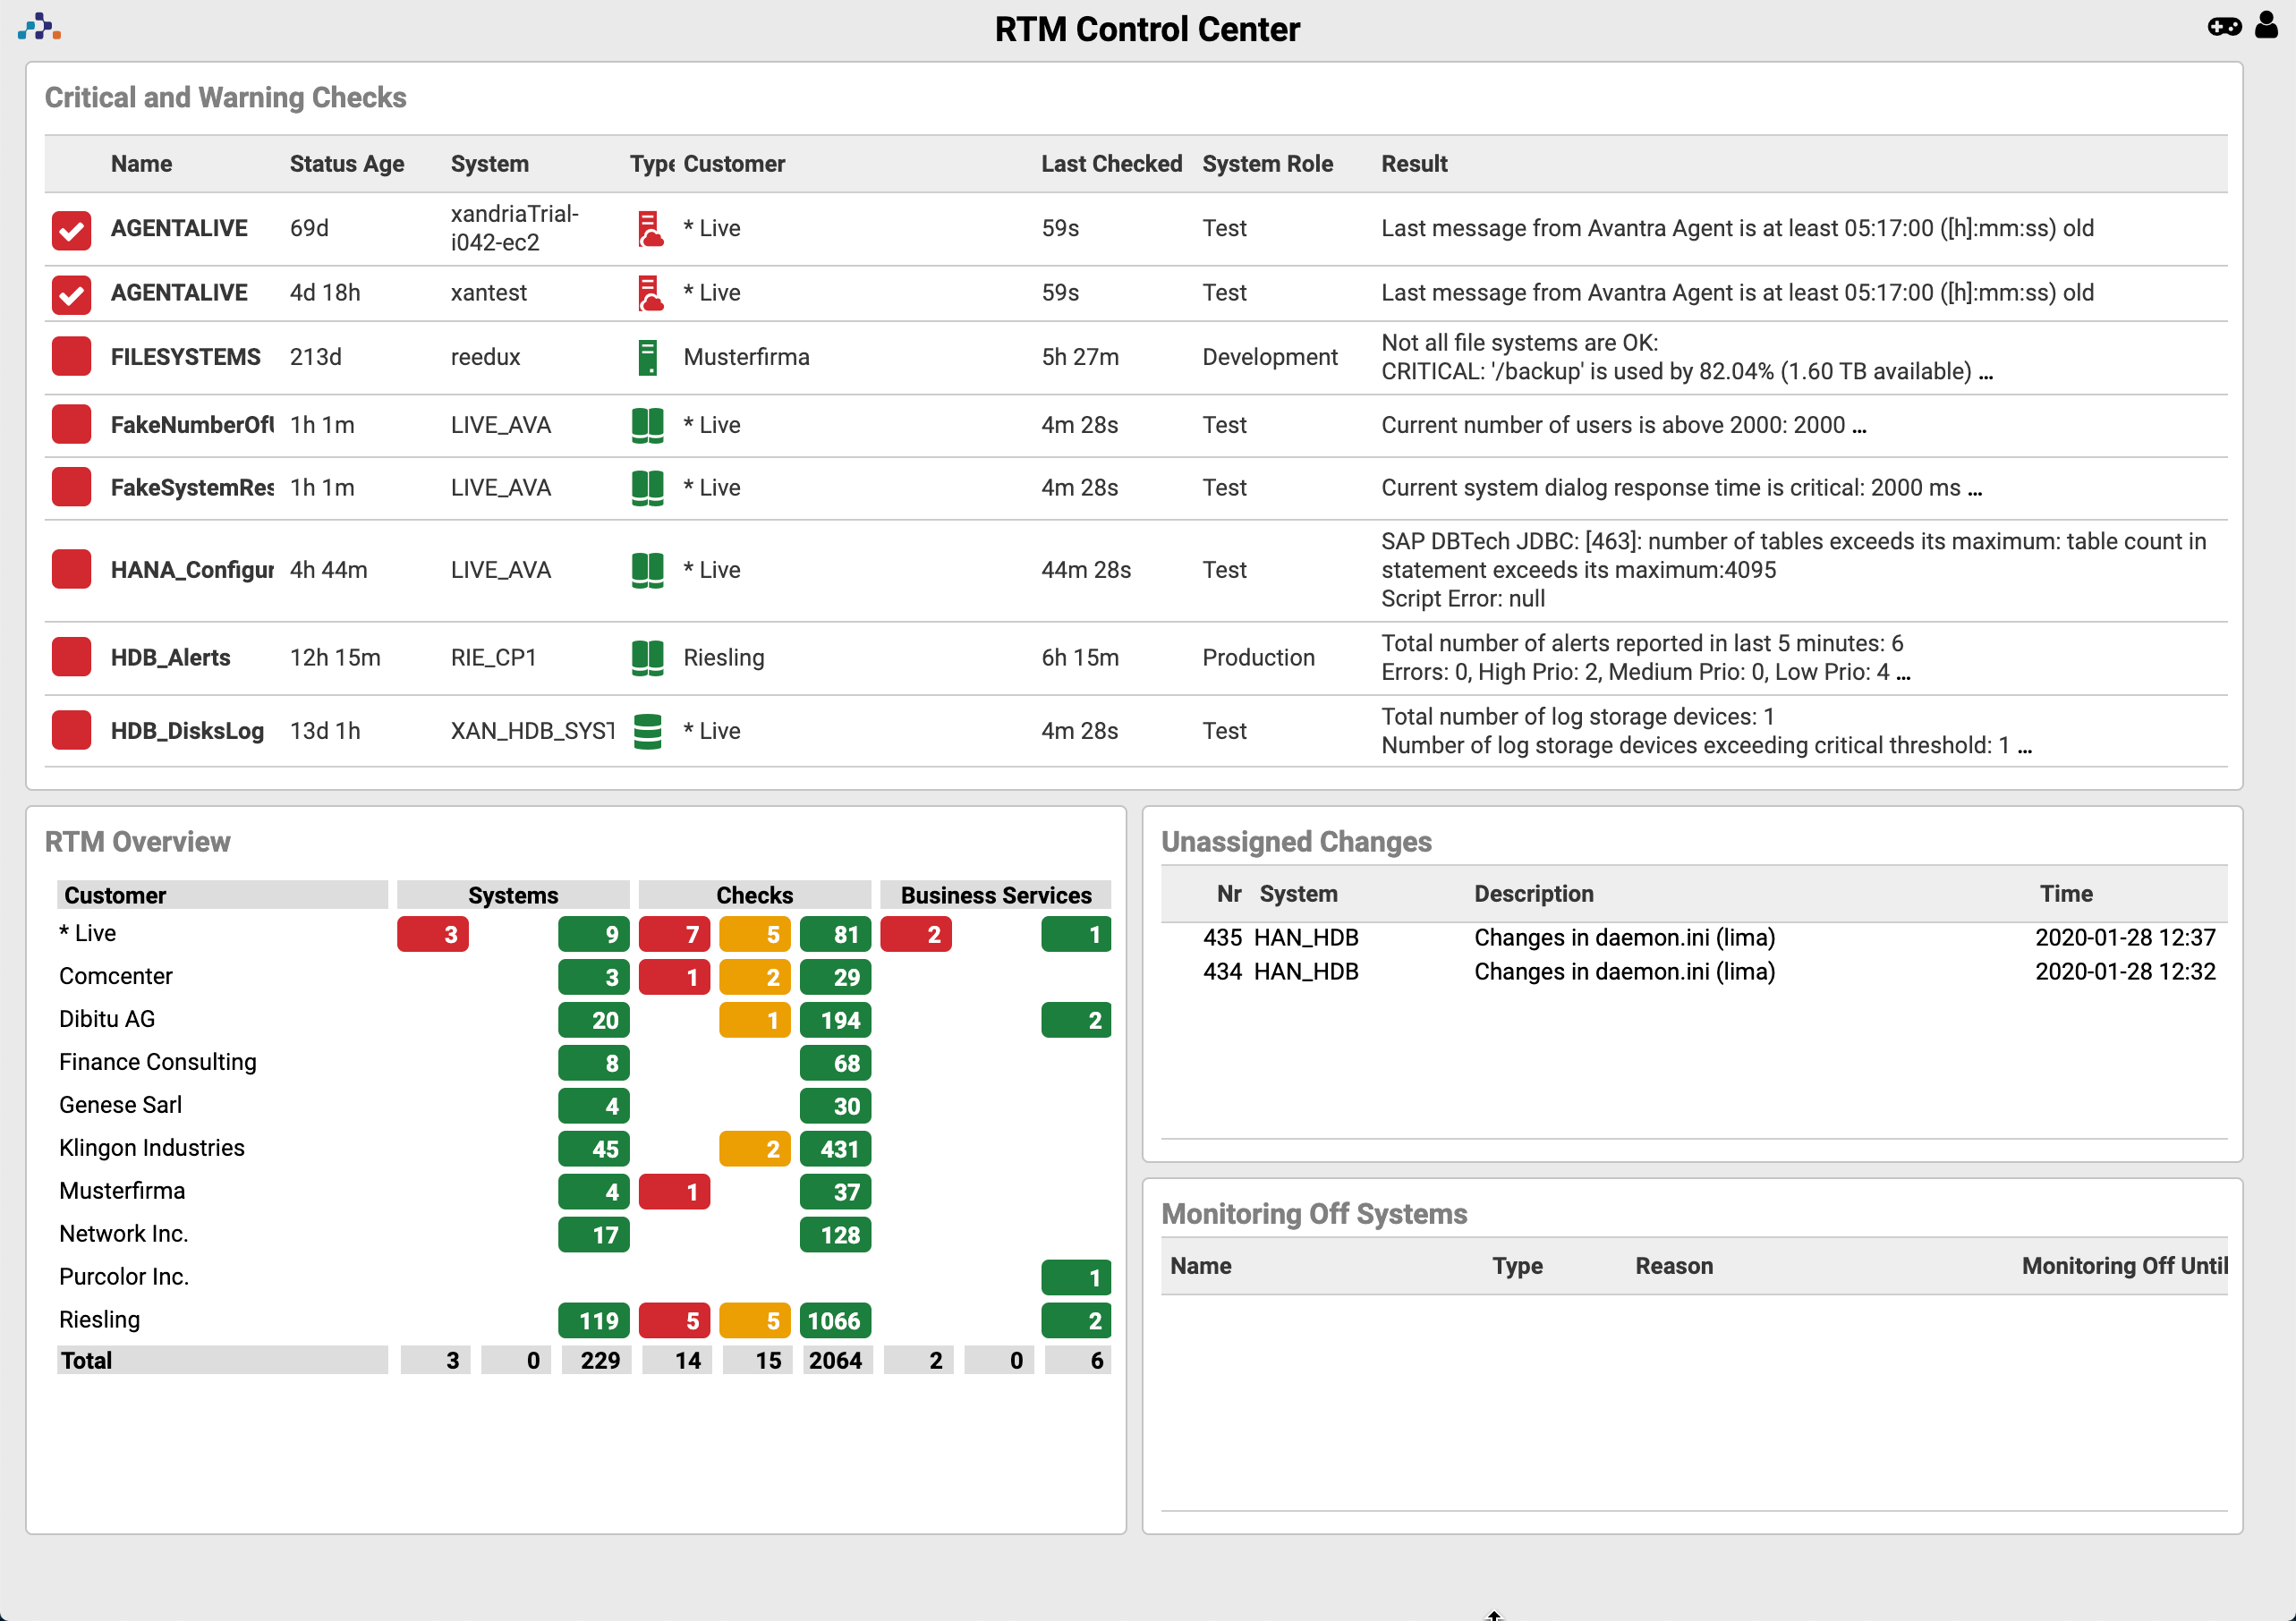
- The top frame of the Control Center view
-
Contains a list of all current Warning or Critical Check Results.
- The lower left frame of the Control Center view
-
Provides an overview of all Systems, Checks, and Business Services per Customer.
- The lower right frame of the Control Center view
-
By default, it contains the so-called unassigned Changes generated by System Change Auto Detection. They stay unassigned until a User processes them (see Systems) having monitoring turned off, and a — optional — list of all unassigned Tickets.
You cannot customize this view. But you can make a copy of the corresponding Dashboard, modify it according to your needs, and save it as a Favorite, or make it accessible by a direct URL. See also System Dashboards.
You can even instruct the UI to use the copied Dashboard as a replacement for the original "Control Center", i.e. to make it accessible through . See RTMControlCenterDashboard.
Using the Business Service Overview
The Business Service Overview provides a detailed view on Business Services.
There is a rotating view of each active Business Service that displays not only the overall Business Service check status, but also the check status of the inbound Checks several levels deep, as well as the inbound Systems (if any).
-
Select from the top-level menu. A new browser window opens.
-
Choose Pause or Continue to pause or continue rotation through the defined Business Services.
-
You can choose Levels and Systems/Checks in order to reduce the amount of information displayed on the page.
You need the Permission View Composite Checks and Business Services in order to use the Business Service Overview.
Working with Daily Checks
Selecting Daily Checks
Select from the top-level menu:
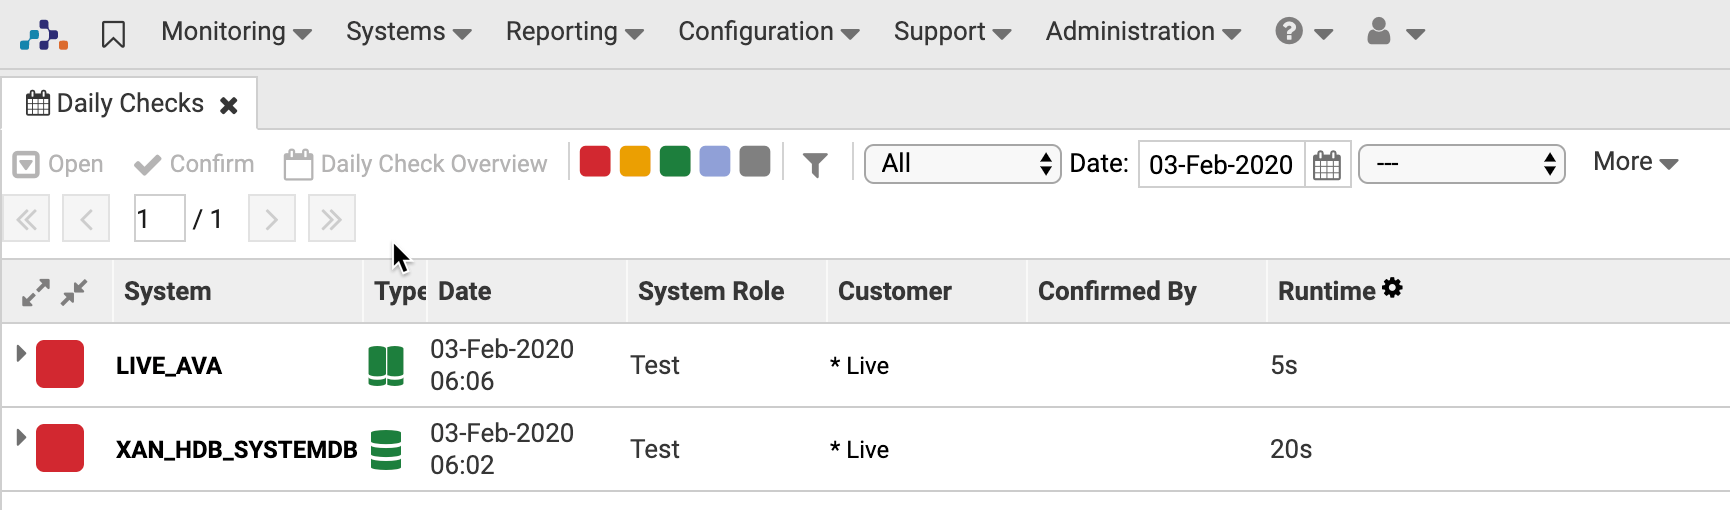
By default, all Daily Checks of the current day are displayed. You can choose different time periods from the drop-down list. Or you can restrict the search to confirmed or unconfirmed Daily Checks only.
There is also an option to restrict the list of displayed Systems by defining an ad-hoc Selectors or by choosing a pre-defined Selectors. Use the drop-down list next to the icon.
Of course, you can use the usual filter options to further narrow your search, and you can use the status icons to filter based on the check status.
If you expand an entry, you will see the Daily Check details corresponding to the selected status icons.
Select one of the items in the list and push the Open button to show all Daily Check details.
If you click on you have the option to restrict the whole view to certain Daily Check Details.
You need the Permission View Daily Checks in order to view Daily Checks, and the Permission Edit Daily Checks in order to modify them.
Daily Check Overview
There is also the option to get an overview of the Daily Checks over a period of time:
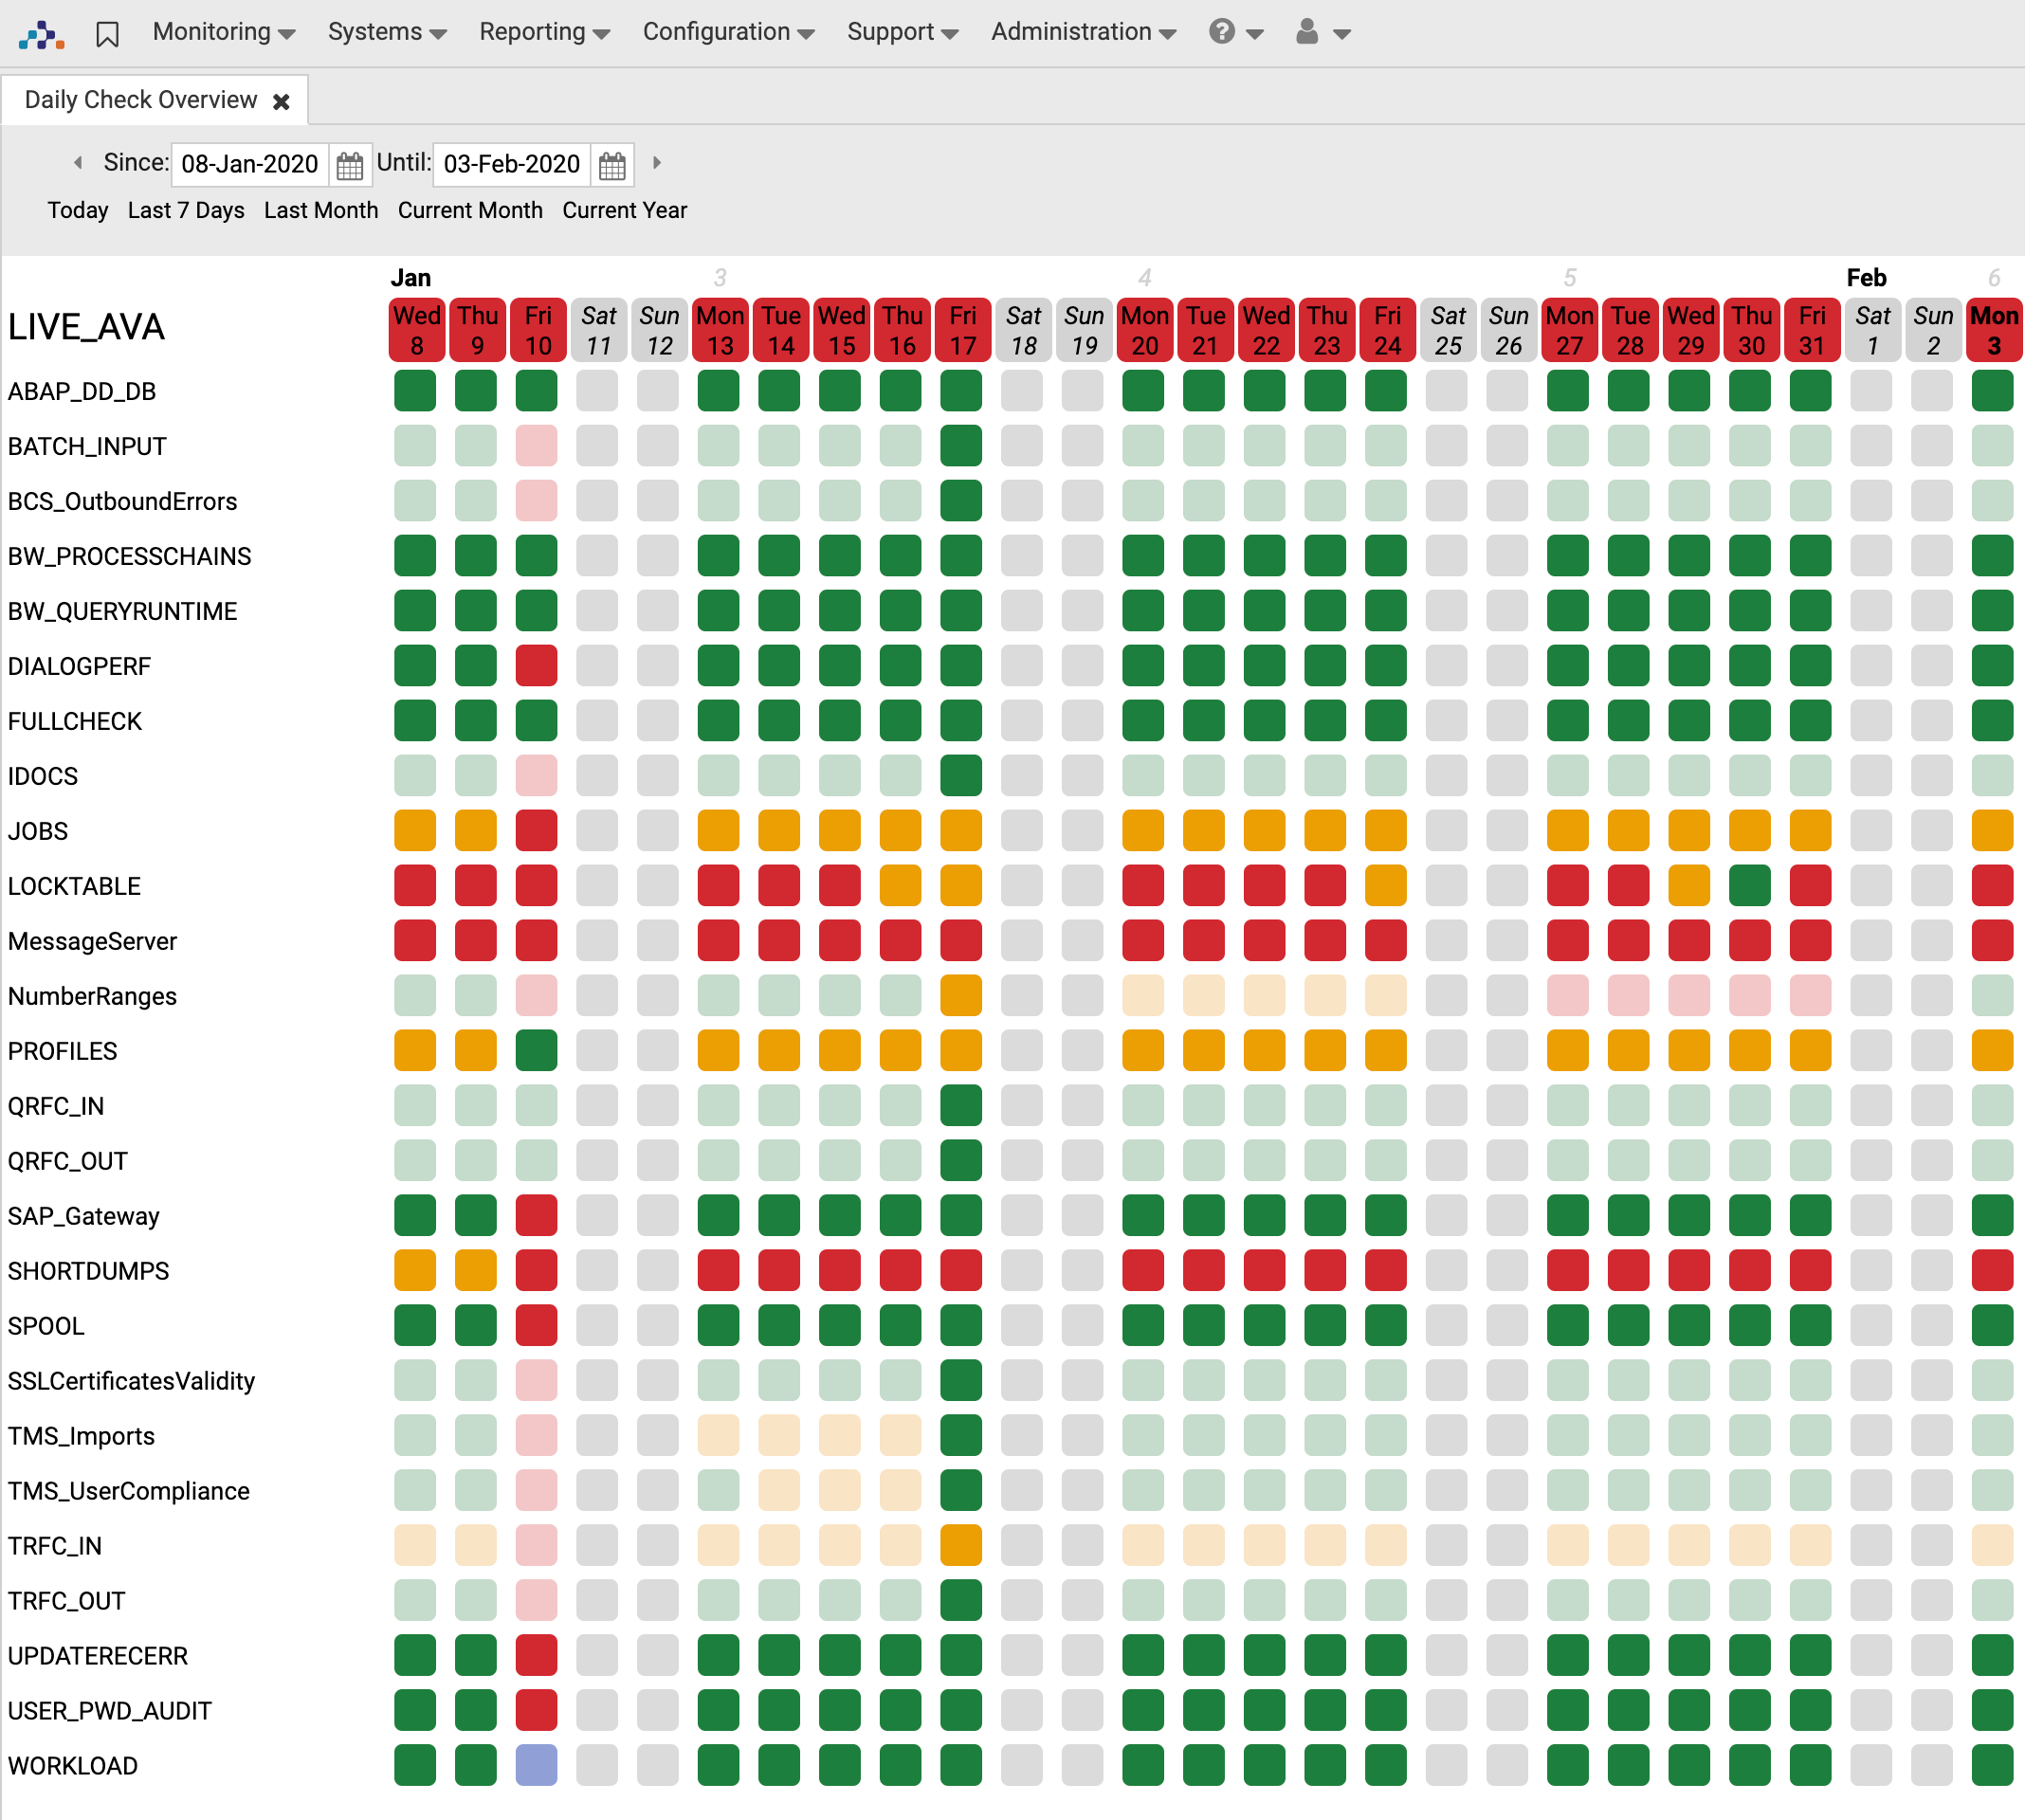
Select from the top-level menu and then select one or more Daily Checks from the list and push the Daily Check Overview. You can choose different time periods from the drop-down list.
You need the Permission View Daily Checks in order to view Daily Check Overview.
Confirming a Daily Check
To confirm a Daily Check perform the following steps:
-
Select from the top-level menu.
-
Select one or more items from the list and push the Confirm button. See Daily Check details.
-
Fill in a confirmation message and push OK.
You need the Permission Edit Daily Checks in order to confirm Daily Checks.
Adding manual Daily Check Details
You can define Daily Check details to be performed manually by an administrator. Manual Daily Check Types are created with check status Unknown. The check status must be changed by the administrator performing the check before the whole Daily Check record can be confirmed.
If you specify a Database type, the Check will only be created in Daily Checks of SAP Systems running on top of the corresponding Database, or of Daily Checks running on the corresponding Database.
Perform the following steps:
-
Select from the top-level menu and switch to the Customizing tab.
-
Select from the page menu.
-
Fill in a Name and select the DBMS Type.
-
Push the Update Manual Daily Check Type button.
Defining relevant Daily Check Details
By default, the overall check status of a Daily Check is the worst check status of all its Daily Check details.
You can define which Daily Check details contribute at all to the Daily Check. Use the RelevantDailyCheckDetails Monitoring Parameter as described in Adding, Modifying, and Deleting Monitoring Parameters and Maintaining Parameter Sets.
Working with Performance Data
Configuring Performance Data Collection
Most of the configuration options have already been described at Performance Data Collection, but we summarize them here and describe some more options:
-
The PerfDataCollection Monitoring Parameters define if or if not Performance Data Collection is executed at all. This parameter is available for Servers, Databases, SAP Instances, and SAP Systems.
-
The Avantra Master properties Performance.PERFDATA_KEEPTIME and Performance.PERFDATA_KEEPTIME_MONTHLY define how long Performance data is kept within Avantra.
-
If you want to collect response times of named transactions, you have to define them using the PerfDataTransactions Monitoring Parameter.
-
You can configure the Top N response time statistics using PerfDataTARuntimeStepsMinPct, PerfDataTARuntimeTop, PerfDataTAStepsTop, and PerfDataTopNIncludeReports Monitoring Parameters.
-
If the Checks the Performance Data Collection is based upon are deactivated, no Performance Data is collected.
-
Some of the thresholds configuring the underlying Checks configure also the display of the Performance Data. If Warning or Critical thresholds are exceeded the points in the Performance Data histograms are colored accordingly.
These are:
-
DialogRespTimeWarn and DialogRespTimeCrit for the Transaction Response Times
-
JavaASAvgRespTimeWarn and JavaASAvgRespTimeCrit for the J2EE Response Times
-
-
End-to-End Response Times are only available if you have configured End Points.
Displaying Performance Data
You can display performance data for every system in Avantra. Choose , , , or and proceed to the Performance tab.
There is a list or even a tree of charts on the left hand side. You can double-click an item to add a chart to the page, and click on the X button to remove it.
You may select the time range of the data globally for all charts displayed. There are pre-defined ranges (Last 24 Hours, Last Week, Last Month, Last Year), or you fill in arbitrary values for Since and Until.
In addition, you have the option to drill into every single chart by dragging a rectangle around the desired region of the chart with your mouse. Click on the icon to restore the original size.
The overall size of the charts may be changed with the + and - buttons.
For every chart there is an option to display raw data in a table, and to export it in a CSV file (using the icon). Once you have arranged all charts on the page, you may export them into a PDF file.
Charts are scaled automatically based on the maximum and minimum values of the data. This may be misleading, especially when it comes to percentage values. There may be situations where the chart draws awfully high (visual) maximum values while the y-Axis in fact shows a range between, for example, 0.3% and 0.6%. In this case it may be more reasonable to adjust the range of the y-Axis to the values between 0 and 100%. You can accomplish this using the icon.
As mentioned earlier, there may be a tree of charts on the left hand side. For example, for an SAP System you can display all the SAP System-related Performance data, but you can also include the ones of the Database instance, other SAP Instances, or even the ones of the Servers comprising the SAP System. This allows to correlate, for example, Transaction Response times with CPU values or Database locks.
You need the View Systems Permission in order to view Performance data.
Configuring Custom Performance Data Resource Types
Custom performance data collection can be done via the RUN_PROG Custom Check, or the JavaScript based Custom Check API of the Custom Checks SQL_QUERY and RUN_JS. But prior to this, you need to define you own custom performance resource types. To do this, follow the the steps below:
-
Select .
-
Click the New button to create a new Performance resource type. A name for the new Performance resource type is required and it has to be defined for which System Type it is relevant. If the System Type is either SAP Instance or SAP System, additionally, the Instance Type can be selected. The checkbox Create default chart definition is checked by default. It means along with a new Performance resource type a chart definition will be created.
-
After pressing Finish, the new Performance resource type is ready and can be used to collect custom performance data. See RUN_PROG custom check: Collect Performance Values on how to do this.
Displaying Custom Performance Data
To display the custom performance data, it is necessary to create a custom chart definition. When the performance resource type is created, there is the option to to create the chart definition as well. But the chart definition can be created afterwards or a second chart definition can be created.
-
Select . Switch to the Charts.
-
Open a chart definition or create a new one to modify colors, axis labels etc.
Working with Availability Data
Viewing Availability Data
You can display availability data data for every system in Avantra. Choose , , , or , or , or and proceed to the Availability tab.
You may select the time range of the data displayed. There are pre-defined ranges (Last 24 Hours, Last Week, Last Month, Last Year), or you can fill in arbitrary values for Since and Until.
Then you have to choose the Service. By default SYSTEM is used to show the availability data of the System. There may be other Services depending on your Custom Check or Composite Check definition. Also, for SAP Systems there is a DATABASE service showing the availability data of the Database instance.
You can also choose the Timezone used for the display of time stamps.
Avantra UI automatically computes the Planned and Unplanned Downtime as well as the Uptime and Achieved Uptime for the time range selected. There is also a list of availability Records shown the way they are stored internally.
An availability record consists of the following fields:
-
Status: This is what availability is all about — status shows if the System or Service has been Up or Down during the time period given by Start and Duration. Additionally, status may have the value Unknown. See also Table: Availability Records and Service Levels.
-
Moni. Switch: The monitoring switch indicates if monitoring was turned on or off during the time period. If monitoring was turned off, the availability record is reported as Planned Downtime instead of Unplanned Downtime in the Service Level Report. If monitoring was turned off due to a Maintenance Window, a tool symbol is additionally displayed.
-
Status Information: Displays the reason for the status, for example, why an SAP Instance was Down, or if a server Up record was computed from the Physical Server's uptime.
Status information values are:
-
BLOCKED: Indicates that an SAP Instance could not be logged into, for example, because all dialog work processes are used. -
DB_RECONNECT_STATE: Indicates that an SAP Instance could not be logged into and is in Database reconnect state, so the database is either down (for example, because of an offline backup) or has a problem. -
DISPATCHER_EMERGENCY_SHUTDOWN: Indicates that the dispatcher has performed an emergency shutdown. This can happen in case of a serious error. -
SHUTDOWN: Indicates that an SAP Instance has been properly shut down. -
Status information for SAP Instances with Oracle Database backed up with
BRBACKUP:-
[SHUTDOWN|DB_RECONNECT_STATE]-OFFLINE_BACKUP_IN_PROGRESS: Indicates that the SAP Instance has either been properly shut down or is in Database reconnect state and an offline backup was processing. -
[SHUTDOWN|DB_RECONNECT_STATE]-ERROR_CHECK_FOR_BACKUP: Indicates that the SAP Instance has been properly shut down but it was not possible to check for a running backup. This may happen if a system has never been backed and no backup run information can be read.
-
-
Generated due to system uptime: A Physical Server is considered available due to its system uptime although the Avantra Agent was not running at this time.
-
You need the View Availabilities Permission in order to view Availability Data.
| If there is no availability data for a particular Managed Object, there will be no such section in the Service Level Report. |
Changing Availability Data
You can edit the Mon. Switch, Status, or Status Info on the Availabilities tab for each System. Or you can use the cross-System and cross-Customer view under from the top-level menu.
Changing the Status Info might be useful, for example, to provide an explanation for a Downtime.
All changes you make manually can be restored to their original values.
To modify availability data for a single System, perform the following steps:
-
Open the Availabilities tab as described in Viewing Availability Data.
-
Select one or more items from the list and push the Edit button.
-
Make your changes in the Status, Moni. Switch, and/or Status Information field.
-
Push the OK button to save your settings.
In order to modify availability data for multiple Systems perform the following steps:
-
Open .
-
You may use Status Filter and Monitoring Switch Filter to narrow your search.
-
Select the desired Systems from the list and push the Edit button.
-
A dialog warns you attempt to edit multiple values. Push Yes.
-
Correct the desired values and push Apply.
All records modified manually will be flagged with a red exclamation mark. If you need to restore the original values, select the desired entry and push the Restore button or the icon.
You need the Edit Availabilities Permission in order to modify availability data.
Availabilities Overview
The Availability Overview displays a snapshot of the currently achieved availability rates over all Systems' Uptimes and Downtimes, and whether or not the assigned Service Level Agreement is met (if any). You can access it using from the top-level menu.
An advanced feature is the forecast of the availability rates. Once you choose an Until date in the future, the column Best Case Uptime shows the extrapolated availability rate, assuming 100% Up for the remaining period. The Remaining Legal Downtime shows the maximum downtime you can afford without breaking the Service Level Agreement.
Comparing SAP and Database Profiles and Components
Within each Daily Check the Avantra Agent sends all SAP Instance and Database profiles and component information to the Avantra server.
|
"Compare Profiles" and "Compare Components" are very powerful tools to find configuration differences in case of trouble. The feature can as well be used to improve the overall configuration consistency of your SAP Systems and Databases. |
Perform the following steps to compare profiles:
-
Choose or from the top-level menu.
Use the filter options to have two or more Systems you want to compare on the same page. If that is not possible, choose two arbitrarily. You still have the choice to adapt your selection in the next step.
-
Select or (for SAP Systems) or push the Compare Profiles button (for stand-alone Databases).
-
Choose one of the options:
- For Profiles
-
Choose the Type and select two or more Profiles from the list using the and icons.
- For Components
-
Choose the Type and select two or more SAP Systems from the list using the and icons.
-
Push the Compare button.
-
Set the All Parameters flag if you want to see all parameters in the result list (instead of only the ones that differ).
-
For Profiles you also have the option to Export the data.
You need the View Systems Permission in order to compare profiles and components.
Communicating with the Avantra Agent
There is usually no need to communicate directly with the Avantra Agents. Avantra UI uses an internal command scheduler and a communication queue.
However, you can issue commands to this queue directly, and in rare cases it might be necessary to verify the command queue.
You can trigger certain actions on the Avantra Agent or send a configuration update.
-
Select , or , or , or , or from the top-level menu.
-
Select one or more items from the list and push the Send to Agent button.
-
Choose the appropriate option and push the Send Commands button.
Set the Send Configuration flag in order to update the Avantra Agent's local configuration (if you are in a hurry and do not want to wait couple of seconds until this is done automatically).
Set the Initialize Agent flag to clear the Avantra Agent's local cache and force a resend of data.
Select the Check Cycle to have the corresponding Checks executed immediately.
Another option is to trigger the immediate execution of Checks. In a Checks tab (of a System or in one of the RealTime Monitoring views you can select one or more entries and hit Execute Now. Push the Send Command button on the pop-up.
You need the Send to Agent Permission in order to communicate with the Avantra Agent.
Displaying and Deleting Imported CCMS Alerts
| Avantra works perfectly well without SAP CCMS. But of course you can activate the integration if you desire. |
CCMS Alerts are available if you have configured a CCMS Custom Check or a CCMS_MONSET Custom Check with the Report CCMS alerts of this MTE to Avantra option selected.
In order to display imported CCMS Alerts perform the following steps:
-
Select from the top-level menu.
-
Select one or more items from the list and push the Delete button in order to delete CCMS Alerts.
Deleting CCMS Alerts is the Avantra way of acknowledging.
You need the Permission Delete CCMS Alerts in order to view and delete CCMS Alerts.