Availability Tracking
Overview
Avantra allows collecting and managing the data about the monitored systems' availability. Availability Data is collected for Servers, SAP systems, SAP instances, Databases, SAP Business Objects and Cloud Services. Data collection is performed locally by the Avantra Agent (except for SAP Business Objects and SAP systems) in order to be independent from any network interruptions, etc. The locally collected availability data is sent and updated on an hourly base. Data for SAP Systems and SAP Business Objects is collected constantly in the background and is updated immediately.
Physical Server Availability
A Physical Server is considered available (or Up) as long as the Avantra Agent installed on it is running. In cases when the agent was down, but the server itself was still running, the Avantra Agent determines (during the startup phase) since when a Physical Server was running by reading the server’s uptime parameter. It then generates availability data back in the past. For time periods the Avantra Agent cannot determine the system is running the availability is considered Unknown.
Virtual Cluster Server Availability
A Virtual Cluster Server is considered available as long as there is an Avantra Agent running on the Physical Server the Virtual Cluster Server is active on (see above).
SAP Instance Availability
An SAP Instance is considered available if the following checks are Ok:
Instance Type |
Check |
Central or Dialog |
RFCConnect |
Central+Java or Dialog+Java |
RFCConnect and J2EECONNECT |
Java |
J2EECONNECT |
Java_Scs |
SCS_MSGSRV |
Abap_Scs |
ASCS_MSGSRV |
Trex |
{_TREX Connect} |
Web Dispatcher |
WD_Connect |
In other words, a SAP Instance is considered UP as long as the Avantra Agent can login. If the login attempt fails, the SAP Instance is considered DOWN.
SAP System Availability
An SAP System is considered available if the SystemAlive check is Ok. Unlike other Availability Data, the data for an SAP system is collected constantly in the background and is updated immediately.
SAP Business Objects Availability
An SAP Business Objects System is considered available, as long as the BO_Alive check status is Ok.
Cloud Service Availability
A cloud service is considered available, as long as the SO_Connect check status is Ok.
Availability Records
The Availability Data is available in the table in the Availabilities tab of the system information pane.
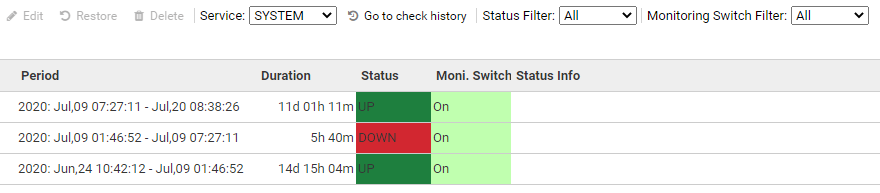
An Availability Record consists of the following fields:
-
Status: This is what availability is all about. Status shows if the system or service has been up or down during the time period given by Start and Duration. Additionally status may have the value Unknown.
-
Monitoring Switch: The monitoring switch indicates if monitoring was turned on or off during the time period. If monitoring was turned off, the Availability record is reported as Planned Downtime instead of Unplanned Downtime in the Service Level Report. If monitoring was turned off due to a Maintenance Window, a tool symbol is additionally displayed.
-
Status Information: Displays the reason for the status, e. g. why an SAP Instance was Down, or if a server Up record was computed from the Physical Server’s uptime. The Status Information values are:
-
BLOCKED: Indicates that an SAP Instance could not be logged into, for example, because all dialog work processes are used.
-
DB_RECONNECT_STATE: Indicates that an SAP Instance could not be logged into and is in Database reconnect state, so the database is either down (for example, because of an offline backup) or has a problem.
-
DISPATCHER_EMERGENCY_SHUTDOWN: Indicates that the dispatcher has performed an emergency shutdown. This can happen in case of a serious error.
-
SHUTDOWN: Indicates that an SAP Instance has been properly shut down.
Status information for SAP Instances with Oracle Database backed up with BRBACKUP:
-
[SHUTDOWN|DB_RECONNECT_STATE]-OFFLINE_BACKUP_IN_PROGRESS: Indicates that the SAP Instance has either been properly shut down or is in Database reconnect state and an offline backup was processing.
-
[SHUTDOWN|DB_RECONNECT_STATE]-ERROR_CHECK_FOR_BACKUP: Indicates that the SAP Instance has been properly shut down but it was not possible to check for a running backup. This may happen if a system has never been backed and no backup run information can be read.
-
Before generating Service Level Reports, you have the opportunity to modify UNKNOWN periods and enter the real availability status during time periods the Avantra Agent could not cover. You can also add additional description, or correct availability records, in case you forgot to plan Maintenance Windows. If a System is Down during a Maintenance Window (or more general: if monitoring is turned off) the Downtime is considered “planned” (as opposed to “unplanned” Downtime). “Planned” Downtime is not counted for the Service Level.
Availability Status |
Monitoring Switch |
Service Level Downtime |
Up |
On |
Uptime |
Off |
Uptime |
|
Down |
On |
Unplanned Downtime |
Off |
Planned Downtime |
|
Unknown |
Unknown |
Unplanned Downtime |
On |
Unplanned Downtime |
|
Off |
Planned Downtime |
Managing Availability Data
You can display Availability Data for every system in Avantra. Choose a system from the top menu (Servers, SAP Instances, SAP Systems, Databases, SAP Business Objects or Cloud Services) and double-click the required system in a table. Then select the Availability tab in the lower part of the screen.
NOTE: You need the View Availabilities Permission in order to view availabilities.
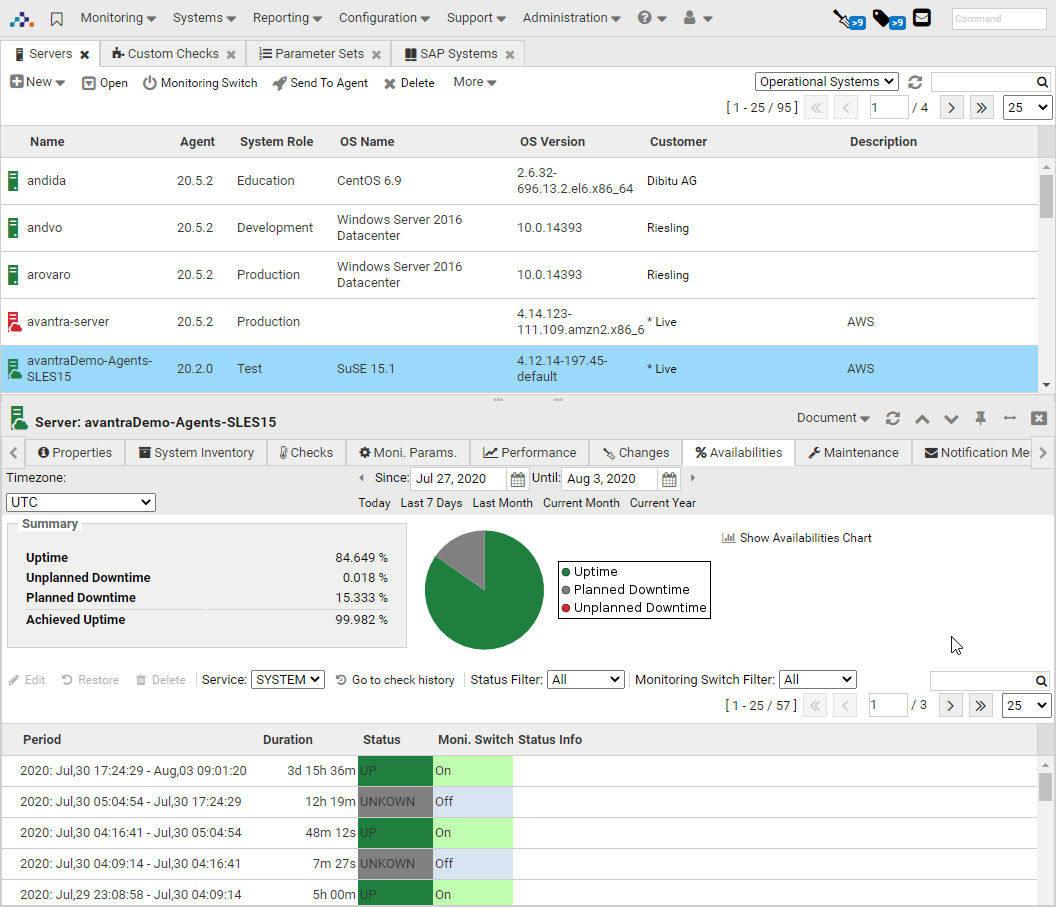
You may select the time range of the data displayed. There are pre-defined ranges (Last 24 Hours, Last 7 Days, Last Month, Current Month, Last Year), or you can enter values in the Since and Until parameters.
Depending on the period selected, the interface displays the graphical representation of the Up/Downtime as a pie chart. Clicking the Show Availabilities Chart option will provide the detailed daily information.
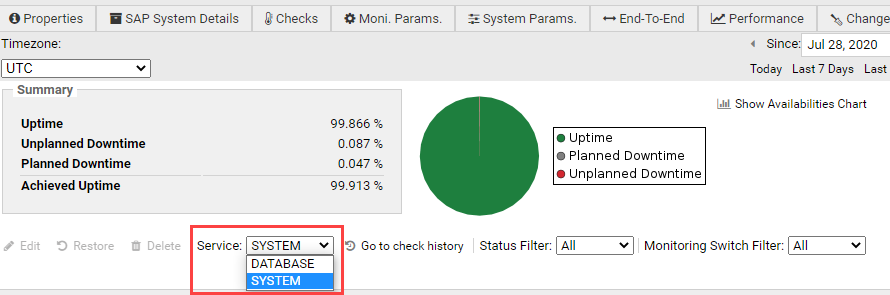
By default, SYSTEM is used to show the System’s Availability Data. However, in case any other system is running in the context of the selected system, and it records the availability, then you can see that system’s availability by selecting it in the Service drop-down list. Such services depend on the Custom Check or Composite Check definition, associated with the system. For SAP Systems, there is a DATABASE service showing the Availability Data of the Database instance.
From the Availability tab you can also do the following:
-
Choose the Timezone used for the displaying of the time stamps;
-
Edit/Restore/Delete the monitoring period by selecting a period in the table and clicking the correspondent icon;
-
Go to the Check history;
-
Filter the periods by Status and/or by Monitoring Switch Status information;
-
Filter each column by value by clicking on the columns' headers.
Changing Availability Data
You can edit the Mon. Switch, Status, or Status Info on the Availabilities tab for each System. Or you can use the cross-System and cross-Customer view under from the top-level menu.
Changing the Status Info might be useful, for example, to provide an explanation for a Downtime.
All changes you make manually can be restored to their original values.
To modify availability data for a single System, perform the following steps:
-
Open the Availabilities tab as described in Viewing Availability Data.
-
Select one or more items from the list and push the Edit button.
-
Make your changes in the Status, Moni. Switch, and/or Status Information field.
-
Push the OK button to save your settings.
In order to modify availability data for multiple Systems perform the following steps:
-
Open .
-
You may use Status Filter and Monitoring Switch Filter to narrow your search.
-
Select the desired Systems from the list and push the Edit button.
-
A dialog warns you attempt to edit multiple values. Push Yes.
-
Correct the desired values and push Apply.
All records modified manually will be flagged with a red exclamation mark. If you need to restore the original values, select the desired entry and push the Restore button or the icon.
You need the Edit Availabilities Permission in order to modify availability data.
Availabilities Overview
The Availability Overview displays a snapshot of the currently achieved availability rates over all Systems' Uptimes and Downtimes, and whether or not the assigned Service Level Agreement is met (if any). You can access it using from the top-level menu.
An advanced feature is the forecast of the availability rates. Once you choose an Until date in the future, the column Best Case Uptime shows the extrapolated availability rate, assuming 100% Up for the remaining period. The Remaining Legal Downtime shows the maximum downtime you can afford without breaking the Service Level Agreement.