Extend Monitoring
The so-called Custom Checks, Composite Checks, Business Services, and Externally Managed Checks are the toolbox Avantra provides to extend the core RealTime Monitoring and Daily Check functions to specific needs.
Extending by Custom Checks
Defining Custom Checks
Some of the Custom Checks can only be defined for SAP Systems or SAP Instances, while the other ones can be defined for every System Type. Custom Checks are always executed on the Physical Server performing the monitoring of the System the Custom Check is defined for.
For some of the SAP-specific Custom Checks, you can choose whether you want to run the Custom Check on the Central SAP Instance or on the Database host.
-
Select from the top-level menu and push the New button.
-
Select one of the Custom Checks from the list (see also Reference: Custom Checks).
-
Fill in a CustomCheck Name. The following characters are not allowed:
/\:*?"<>| -
Select the appropriate System Type. The Custom Check will then be executed in the context of the chosen system type, i.e. is executed when the corresponding Check Cycle of the system runs. Not all System Types are available for every Custom Check.
-
Choose a Customer if desired. In case you select one, only the Systems of this Customer (and its descendants, in case a Customer hierarchy is used) are considered. Also, a User needs to have the Permission View Custom Checks / Edit Custom Checks for the named Customer in order to view or modify the Custom Check.
If you leave this field empty, Systems of all Customers are considered, but one needs the Permission View Custom Checks / Edit Custom Checks for all Customers in order to view or modify the Custom Check.
-
Press Create to create the record. The details for the newly created Custom Check are opened. The definition is not yet complete and thus the new Custom Check is not yet active.
-
Optionally, add a meaningful description.
-
Optionally, choose an execution cycle. By default, Custom Checks are run in the Basic Check Cycle of the Avantra Agent (list value RTM). You may enter your own execution cycle, or run the Custom Check in the daily cycle, (see Full Check Cycle).
The actual cycle time is always 'rounded' up to the next Basic Check Cycle execution time. For instance, if you enter 8 minutes as the cycle time and the Basic Check Cycle is 5 minutes (as per default), the check will be executed every 10 minutes in every 2ndBasic Check Cycle.
-
Choose one of Select a Pre-Defined System Selector or Define specific 'Ad-Hoc' Custom Selection. In the first case, choose the desired Selectors from the list.
You can define a specific ad-hoc custom selection (which is only valid for this particular Custom Check if you have set the flag next to Define specific 'Ad-Hoc' Custom Selection. Push the Create button. Fill in selection criteria, push the Test Selector to verify the Systems, and hit the Save & Close button.
-
In the Specific section, fill in the values according to the description in Reference: Custom Checks.
-
Push the Apply button to save your data.
A dialog Activate Custom Check appears and asks you whether to activate the Custom Check or not. Choose Yes if everything is fine or No if you want to make changes.
|
You can disable Custom Checks as described in Systems the Custom Check is defined for. If you deactivate the Custom Check, it is disabled on all defined Systems, obviously. |
Listing Custom Checks by Type
In larger Avantra installations, you may come across many Custom Check definitions and you may lose the overview. To help you in such a situation, there is a special list view.
If not already there, go to and then choose .
A new tab will be opened and all Custom Checks of the same type will be displayed including configuration parameters in a list. If you want to edit one, you can simply double click to open it as in the main list and then make your changes.
|
Please note that by default not all configuration parameters are displayed, since the table may have many columns. However, you can select the parameters you would like to be displayed by clicking on the small cogwheel icon on the last column. |
Exporting and Importing Custom Checks
Custom Check definitions can be exported to a zip file and imported to another Avantra server. This might be useful if you have tested a custom Custom Check on a test Avantra Server before you want to make it productive on another one. You may as well pass Custom Check definitions to other Avantra users.
-
Select from the top-level menu and select the Custom Checks you would like to export from the list. You can use the Ctrl and/or Shift keys of your keyboard to select multiple Custom Check list entries to be exported in one step.
-
Either click the right mouse button on one of the selected entries and choose Export Custom Checks or choose More and same menu item.
-
In the following dialog, fill in an appropriate name for the export file or confirm the default one by pressing the Export button.
-
Confirm the information message that the zip file containing the Custom Check definitions has been exported to the download area of your browser.
|
If a RUN_PROG Custom Check is configured with a program to be deployed, this program is included in the Custom Check export file. If the Custom Check definition uses a Pre-Defined System Selector, the name of this System Selector is included in the Custom Check export file. During import, the Avantra UI will check if a selector of the same name exists in the target system, and if yes, it will assign this selector to the imported Custom Check definition. 'Ad-Hoc' Custom Selection is not exported. |
-
Select from the top-level menu.
-
Choose More and select Import Custom Checks.
-
A dialog Import Custom Checks - Select Custom Check Package is displayed. Press Upload to upload a Custom Check definition export file. When the package is displayed, press Next to continue.
-
The Custom Check definitions found in the export file a displayed. Select the ones to be imported by pressing the appropriate buttons to move the items from the left to the right area of the Select Custom Checks dialog step and press Next to continue.
-
The Import Settings dialog step is displayed. If a Custom Check with the same name does already exist in the target system, it will be displayed in red color. You can either create a new one with a different name, or you can choose to update the existing one. Press Next to continue.
-
The last dialog step is displayed to confirm your settings. Either press Import to run the import, Back to change your settings or Cancel to completely cancel the import process.
|
The newly imported Custom Checks will always be inactive and must be activated before they are actually applied. If the exported Custom Check definition included a Pre-Defined System Selector name, the import will assign a System Selector of the same name to the imported Custom Check definition. 'Ad-Hoc' Custom Selection is neither exported nor imported. In this case, the Systems section is empty and must be configured before the Custom Check is made active. |
Defining Custom Monitoring Parameters
There may be cases where you need to pass certain information to the Custom Check definition that varies, for example, between the Systems the Custom Check is applied to. You can use Custom Monitoring Parameters exactly for this purpose.
In order to define a new Custom Monitoring Parameter, proceed as follows:
-
Open from the menu and switch to the Custom Monitoring Parameters tab.
-
Push the New button and fill in a Name. The name has to start with the prefix
cust.. -
Select a System Type, a Unit, and push the Create button.
-
Open the newly created item, and optionally fill in a Default Value and a Description. Push Apply if you made any changes.
This parameter and the default value eventually defined is automatically known to all Avantra Agents. You can define values at a per-System level as described in Adding, Modifying, and Deleting Monitoring Parameters, or in a Parameter Set as described in Maintaining Parameter Sets.
Using Custom Monitoring Parameters in Custom Checks
You can reference Custom Monitoring Parameters everywhere you can use Custom Check Macros. If you have defined a parameter cust.MyMonitoringParameter, you can reference it using ${moniparams.cust.MyMonitoringParameter}.
The JavaScript-based Custom Checks SQL_QUERY and RUN_JS provide a new API call to access all monitoring
parameters including the custom ones. The syntax is monitoredSystem.getMoniParam("cust.MyMonitoringParameter").
Defining your own Log Adapters for the Log Adapter Custom Check
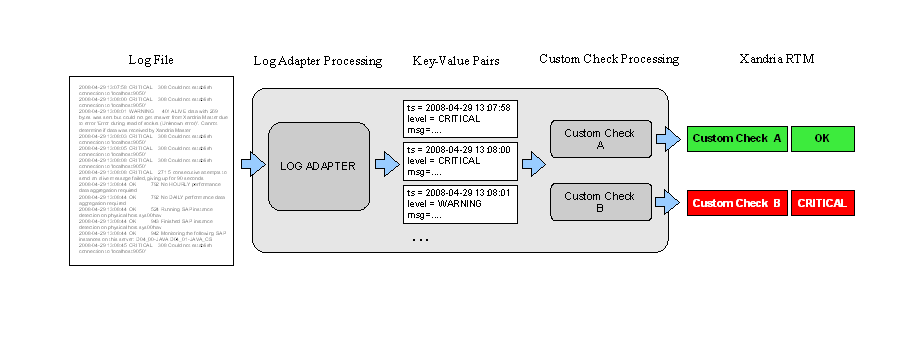
Log Adapters are used in the DB2_DIAGLOG and ORA_ALERTLOG Checks as well as in the LOG_ADAPTER Custom Check in order to monitor the contents of a log file, either a Windows Event Log or a plain text file.
The task of monitoring logs is split into two steps: First Log Adapters extract the entries of a log entry and transform the data into a set of key-value pairs (so-called Macros) representing the log entry in Avantra. Then, a set of rules defined in the Checks listed above evaluates these key-value pairs in order to decide whether an alert must be raised.
This section discusses the first step of the processing. For the setup of a LOG_ADAPTER Custom Check, see Defining Custom Checks.
See also the image below:
|
There is a set of pre-defined Log Adapters: Select from the top-level menu. |
Defining a Windows Event Log Adapter
Avantra features default Log Adapters for the Windows Event Log types Application and System. Windows Event Log Adapters provide fixed key-value (Macro) pairs for further processing corresponding to the available Windows Event Log fields. You cannot change the Macro names of the fields for Windows Event Log Adapters.
To create a Windows Event Log Adapter, proceed as follows:
-
Select from the top-level menu. A list of all existing Log Adapters will be shown.
-
Push the New button.
-
Choose Windows Event Log as Log Adapter Type and enter a name for the Log Adapter.
-
Push New. Open the newly created item from the list.
-
Enter the desired Windows Windows Event Log Name for the Log Adapter.
-
Push Apply.
Defining a File-based Log Adapter
Setting up a File-based Log Adapter is a little bit more complex as you have to tell Avantra about the structure of the entries in the log file and about the data you want to retrieve from it.
A File-based Log Adapter consists of one or more of the so-called Token Parsers, each of which extracts a certain amount of characters from a single log entry. All the defined Token Parsers together are supposed to read the whole log entry.
Each Token Parser has the following elements:
- Type
-
Defines the type of the Token Parser, i.e. how the target token should be interpreted (a timestamp, block of text, etc.).
- Identifier
-
Defines the name of the Macro for the token value for use in Expressions in the LOG_ADAPTER Custom Check. If not defined, the token will be parsed but not evaluated and hence not be accessible in the Custom Check.
- Description
-
Defines a description for display purposes. This description will appear as tool tip (on mouse rollover) when using the token as a Macro in the LOG_ADAPTER Custom Check.
- Parameters, Parameter Values
-
Type dependent parameters like terminators, format strings, etc.
- Opt
-
Indicates whether the token is optional. This allows modeling variable log file formats. If you specify a token to be optional by selecting the Opt. check box, the token is not required to be present for a match of the respective log entry; log entries that do not contain a corresponding token will be matched anyway. Contrary, when a token is not optional, a log entry not containing the token will not be matched and hence be omitted.
This element is not available for all Types.
Available Token Parser Types are listed in the following table:
Token Parser |
Parameter |
Examples |
||
|---|---|---|---|---|
Type |
Purpose |
Name |
Values |
|
KEYVALUE |
Tokens which feature a key-value pair. Parses tokens which start with the indicated key, followed by zero or more white spaces, and an optional delimiter, followed by arbitrary text up to a specifiable terminator. Skips any preceding characters up to the first match of the key. |
KEYS |
List of keywords. If more than one, separated by | (pipe) |
|
DELIMITERS |
List of delimiters. If more than one, separated by | (pipe) |
|||
TERMINATORS |
List of terminators for the value field. If more than one, separated by | (pipe). |
|||
NUMBER |
Tokens which represent a numeric value. This Token Parser type covers integers and floating-point numbers, with or without exponential representation. Skips preceding white spaces. |
|
||
PATTERN |
Tokens with specific formatting. Skips preceding white spaces. |
FORMAT |
A format string matching the formatting of the token. |
|
TEXTBLOCK |
Tokens which represent an arbitrary text sequence. Parses all characters up to a specified terminator or up to the end of the log entry. Skips preceding white spaces. |
TERMINATORS |
List of terminators which define the end of the text block. If more than one, separated by | (pipe). |
|
TIMESTAMP |
Tokens which represent a timestamp. |
FORMAT |
A format string matching the timestamp’s format. |
|
UNWRAP |
Tokens wrapped by a prefix and a suffix. This token parser type returns the text between prefix and suffix. Skips preceding white spaces. |
PREFIX |
List of prefixes, if more than one, separated by | (pipe). |
|
SUFFIX |
List of suffixes, if more than one, separated by | (pipe). |
|||
|
If you specify a |
Also, see the following image:
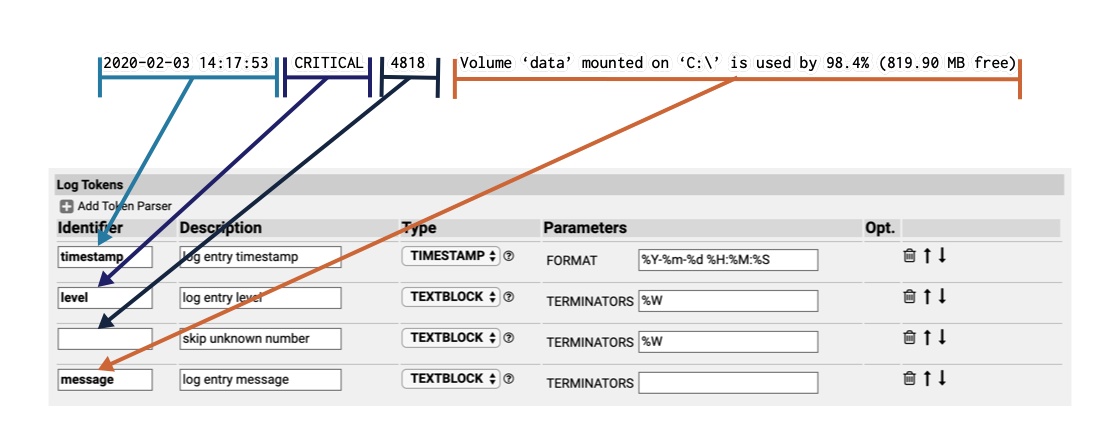
Each of the Token Parser Parameter Values may contain meta characters, also known as patterns, which are explained on the Edit Token Parser page in Avantra UI and must not be confused with the PATTERN Token Parser itself. See also Step 8b of Procedure: Creating a File-based Log Adapter.
|
There are a few important conventions and rules you should consider when building a File-based Log Adapter:
|
To actually create a File-based Log Adapter, proceed as follows:
-
Get a reasonable extract from an example log file containing the interesting log entries and copy it to your clipboard.
-
Select from the top-level menu. A list of all existing Log Adapters will be shown.
-
Push the New button.
-
Choose File Adapter as Log Adapter Type and enter a name for the Log Adapter.
-
Push New. Open the newly created entry from the list.
-
Enter a description for your Log Adapter on the Edit Log Adapter page.
-
Switch to the Parser Definition tab.
-
For each Token Parser, do the following:
-
Push the Add Token Parser button. Choose an appropriate Token Parser from the drop-down list in column Type, enter an Identifier in order to make use of the extracted token in a LOG_ADAPTER Custom Check, and a Description.
-
Fill in appropriate Parameter Values, if applicable. You can display the patterns available in the Parameter Values fields if you click the icon.
-
Switch to the Test Parser tab and push the Parse button. If you defined the Token Parser properly, the matched entry should be highlighted in the text box.
-
Push the Parser Definition button.
To add another Token Parser, push the Add Token Parser button and repeat starting at Step a.
If you need to add another Token Parser between two existing ones, you have to add a new Token Parser to the end and subsequently move it to the correct location using the and icons.
To remove a Token Parser, press .
Bear in mind that the first defined Token Parser is used to split the log file into log entries. If your log file contains a timestamp, it is highly recommended to use a TIMESTAMPas the first Token Parser.
-
-
Push the Apply button to save.
-
Switch to the Test Parser tab. Push the Enter log file sample button and paste the data copied in Log Adapter definition with real-life data.
Duplicating Log Adapters
Instead of creating a Log Adapter from scratch, it might be easier to start based on an existing definition.
Perform the following steps to duplicate a Log Adapter:
-
Select from the top-level menu. A list of all existing Log Adapters will be shown.
-
Select an appropriate Log Adapter from the list.
-
Push the Copy button.
-
Proceed as described starting at Step 8 of Procedure: Creating a File-based Log Adapter
|
Duplicating an existing Log Adapter and modifying it is the preferred method over simply modifying an existing one. Log Adapters can only be modified in a very simple manner once they are used in a LOG_ADAPTER Custom Check. |
Deleting Log Adapters
|
You can only delete Log Adapters that are not used in any LOG_ADAPTER Custom Check. |
Perform the following steps to delete a Log Adapter:
-
Select from the top-level menu. A list of all existing Log Adapters will be shown.
-
Select the appropriate list item(s).
-
Push the Delete button.
Exporting and Importing Log Adapters
Perform the following steps in order to export a Log Adapter:
-
Select from the top-level menu. A list of all existing Log Adapters will be shown.
-
Select an appropriate Log Adapter from the list.
-
Push the Export button to download the file.
Perform the following steps in order to import a Log Adapter:
-
Select from the top-level menu. A list of all existing Log Adapters will be shown.
-
Push the Import button and select an appropriate
.lgafile. -
Push the Upload button.
-
Proceed as described starting at Step 8 of Procedure: Creating a File-based Log Adapter.
Configuring SAP CCMS using Avantra
Avantra is able to write configuration items into CCMS by means of the CCMS Custom Check.
|
You need to be familiar at least with the following CCMS terms:
We strongly recommend that you study at least the sections "Concept of the Monitoring Architecture", "Operating the Alert Monitor" and "Customizing the Alert Monitor" of the chapter "The Alert Monitor" of the SAP Library. Additionally, you need to be familiar with the SAP transactions |
CCMS Configuration Variant
By default, Avantra will not change any existing CCMS settings in your SAP System.
All settings applied by Avantra will be saved into a new "properties variant" called SYSLINK. However, by default this new variant will automatically be made active, i.e. the settings configured through Avantra will actually be used. A "properties variant" can be thought of as a group of changes to CCMS properties.
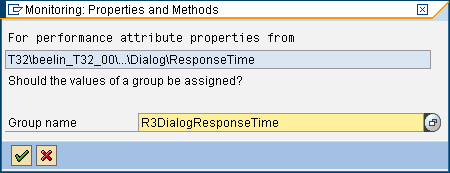
You can figure out the current active variant using transaction RZ21. If settings have been successfully defined by Avantra, SYSLINK will be displayed as an active variant like shown in the following image:
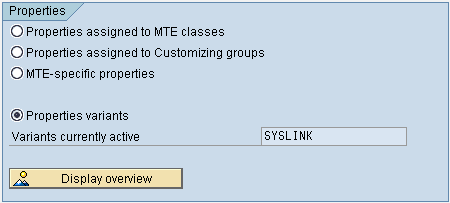
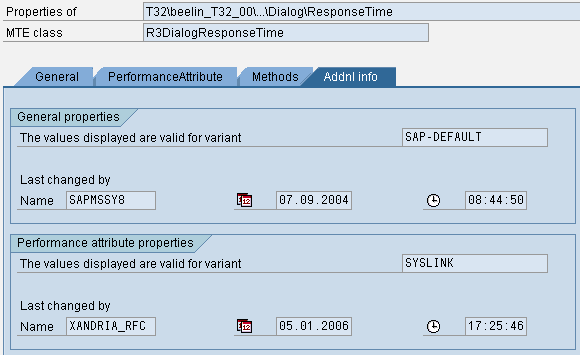
You will find in the Additional info tab of the configured MTE properties screen that the values displayed are valid for variant SYSLINK.
See the following image:
You can easily get an overview of all CCMS configurations applied to your SAP System by Avantra. Simply query for properties in transaction RZ21.
CCMS Configuration for individual MTE
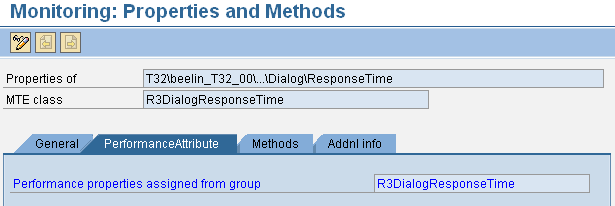
By default, the CCMS configuration settings applied by Avantra will change the properties of the underlying class or customizing group of the MTE. The changed properties will in turn apply to all MTEs that belong to this class or to all attributes of a customizing group, respectively. This is the practice recommended by SAP.
That means if you have an SAP System with multiple SAP Instances and you change the "performance properties" of the Dialog\ResponseTime MTE, all SAP Instances of the SAP System will have the new properties applied. By default, the properties will be saved to the customizing group R3DialogResponseTime which in turn is by default assigned to allDialog\ResponseTime MTEs. See the image below:
You can configure Avantra to apply settings to an MTE individually. This might be useful, for example, if you have SAP Instances serving different purposes and you desire to monitor response time settings on a per SAP Instance level.
|
Using CCMS settings for MTEs individually is a decision that is only reversible manually. You need to reassign the class/group using transaction |
If you have chosen configuration of individual MTE in a CCMS Custom Check and you revert this change in the Custom Check, you will get the following error message displayed in the Check Result in RealTime Monitoring:
XAL interface error: No data available for MTE class of the MTETo remove the cause of this error, perform the following steps for each affected SAP System:
-
Log on to the SAP System and proceed to transaction
RZ20. -
Edit the properties of the corresponding MTE.
-
Choose .
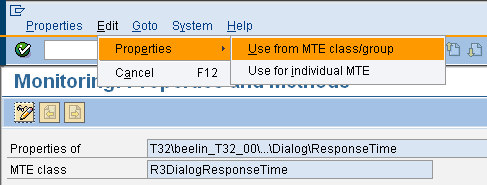
-
Assign the correct class/group to the MTE.
Configuring SAP CCMS using a CCMS Custom Check in Avantra
Please make sure the following prerequisites are fulfilled:
-
You have defined a CCMS Custom Check (as described in Check) and it is running properly, the MTE values are displayed properly in the RealTime Monitoring.
-
You have figured out the CCMS settings you plan to configure. You have tested the settings of the corresponding MTE at least on one SAP Instance or SAP System using SAP transaction
RZ20. The properties dialog inRZ20performs consistency checking whereas Avantra does not. -
You have read and understood CCMS Configuration Variant.
-
You have read and understood the implications outlined in CCMS Configuration for individual MTE
Perform the following steps:
-
Select from the top-level menu. Choose the desired Custom Check from the list and push the Open button.
-
Switch to the CCMS Configuration tab and push the Create button.
-
Fill in the settings you like to write to CCMS.
We strongly recommend filling in only the settings you want to modify! Leaving all other fields empty ensures that the original settings in CCMS are untouched. You need to enter at least one setting, either for the General Properties or for one of the Attribute Properties.
If you want to configure an attribute type, please make sure that your MTE really includes an attribute at all and you chose the correct type. Otherwise, the following error message will be displayed as Check Result:
XAL interface error: Invalid CCMS configuration:
Log Attribute settings cannot be applied to the MTE actual class 'Performance Attribute'
MTE attributes are displayed in the second tab of the MTE properties screen in
RZ20. See also Image: CCMS MTE with performance attributePlease note that there are MTEs without any attribute, like "monitoring objects" and "summary nodes". For these types of MTEs, you can still configure the General Properties. Attribute Properties settings for MTEs not including any attribute type are simply ignored.
-
If desired, flag the Use for individual MTE check box. See also CCMS Configuration for individual MTE.
-
Push the Update Custom Check button to save your settings.
Verify if the configured CCMS settings have been correctly applied to your SAP System. In case of problems, consult the check message in the RealTime Monitoring first. If you find an error message
XAL interface error: No additional information available
(function BAPI_SYSTEM_MTE…)
or you do not find any error message in there, but the settings were not stored into CCMS, you might need to apply hot fixes or the latest support packages to your SAP System. See also SAP Note 798941 BAPI XAL does not work completely after Note 778056.
Extending by Business Services and Composite Checks
Introduction to Business Services and Composite Checks
| This function is only available with the Avantra Pro Edition. |
Composite Checks and Business Services are tools that allow you to build new RealTime Monitoring Checks based on existing built-in Checks, Custom Checks, or even other Composite Checks or Business Services.
Every Composite Check and every Business Service consists of one or more inbound Checks and an evaluation rule that provides an outbound Check Result based on the inbound check status.
The inbound Checks can be any existing RealTime Monitoring Check or a System Status. They can be deferred using a configurable delay.
Differences between Business Services and Composite Checks
The differences between these two categories are:
-
Every Composite Check runs in the context of a System. Therefore, it can have any Check running in the context of this System as an inbound Check. Even more, a Composite Check for an SAP System can also use Checks executed for the SAP Instances of the SAP System in question or the hosting Servers as inbound Checks.
-
A Business Service runs in the context of a Customer directly, i.e. a Business Service is a Check and a Managed Object at the same time. It therefore can have any existing inbound Check, even across Customer boundaries. Even though a Business Service is assigned to a particular Customer the inbound Checks are not limited to this Customer. They are only limited by the Permissions of the User creating the Business Service.
-
Since a Business Service is a Managed Object (similar to a System), it needs to have a System Role.
-
Composite Checks can be defined to run on a Dynamic Group or Static Group of Checks, similar to Custom Checks (also called the Scope in this context), whereas every Business Service definition corresponds to exactly one (outbound) Check.
Building Blocks for Business Services and Composite Checks
General Properties
Composite Checks and Business Services have the following general properties:
- Name
-
A unique name for the Composite Check or Business Service.
- Description
-
A meaningful description of the Composite Check or Business Service.
- Service Name
-
You may record Service Availability for the Check and provide a meaningful name. You can also decide to consider a Warning outbound check status as Up.
- Input Scope
-
This Customer defines the scope for the Composite Check or Business Service. Only Systems that belong to this Customer can be used in this Composite Check or Business Service. And only users who have Permissions on this Customer are allowed to view or edit this Composite Check or Business Service.
Note that a Customer hierarchy is considered in selecting Systems for the Composite Check or Business Service.
A User needs to have the Permission View Composite Checks and Business Services / Edit Composite Checks and Business Services for the named Customer in order to view or modify the Composite Check or Business Service.
- Role (Business Service only)
-
A role name with the same meaning as System Role.
- Assign to Customer (Business Service only)
-
The check result of the Business Service is assigned to this Customer. The result status of the Business Service is visible in RealTime Monitoring.
System Scope
(Composite Checks only)
You can define a Dynamic Group or Static Group of Systems the Composite Check is executed for.
The System Scope is restricted to the Systems and Checks of the Customers defined, or to all Customers if no Customer is defined (Composite Check) or if the All Customers flag is set (Business Service).
The System Scope definition is implemented by means of System Selectors, (see Defining a System Selector).
Functions
Functions define the rule of how a Composite Check or a Business Service evaluate inbound check status to an outbound check status. There are four Function types available that can be nested.
- All OK
-
Returns Ok if all inbound check statuses are Ok (otherwise Critical).
- One OK
-
Returns Ok if at least one inbound check status is Ok (otherwise Critical).
- Worst
-
Returns Critical if at least one input is Critical, Warning - if at least one input is Warning, Unknown - if at least one input is Unknown (otherwise Ok).
- Expresso
-
Roughly speaking, the Expresso function returns Ok if n out of m inbound check statuses are Ok. More exactly, it provides the means to build an if-then-else construct computing the outbound check status using comparators and limits for the inbound check status.
- Script
-
Allows you to define almost any conditional statement to compute outbound check status based on inbound check status.
- Delay
-
Allows you to (only) defer the inbound Check Result for a defined period of time.
All Functions provide the following common attributes:
- Name
-
A unique name (within the Composite Check or Business Service) to identify the Function.
- Description
-
A meaningful description of the Function.
- Deferral
-
Inbound check status can be deferred, for example, an inbound Critical can be considered Ok unless it remains Critical for more than 10 minutes.
- Result Message
-
By default, the check messages of the inbound Checks for the outbound check message. But you can either suppress the inbound check messages being passed, or you can define your own check message for the Function.
Selectors
System Selectors provide means to dynamically select inbound Systems and the corresponding Checks for use in Functions. In order to use an inbound System Status, you will select one or more Systems. For inbound check status you will select one or more Checks.
Every Selector consists of a Name and a Description to identify it within the context of the Composite Check or Business Service. It allows you to define nested search criteria and the option to include or not the System having monitoring turned off.
If you want to use (inbound) RealTime Monitoring Checks rather than the System Status you can select them as well.
System Selectors are restricted to the System Scope or to the Input Scope.
Direct input of Checks or Systems
Instead of dynamically defining the inbound Checks using System Selectors you can also add Checks or Systems as direct input for a Function.
Checks or Systems are restricted to the System Scope or to the Input Scope.
Design, Test, Verify, Evaluate, Activate
There is a Design pane where you can plug all the things together and edit the required properties. For the System Selectors, there is a Test function that shows the result set of a dynamic search. Once you have put all the pieces together you can Verify the whole Composite Check or Business Service. This is first of all an integrity check to point you to missing or inconsistent setups.
Then you have the opportunity to Evaluate the Composite Check or Business Service, i.e. to execute the Check with all the current inbound check status.
Finally, you would need to Activate the whole Check in order to evaluate it periodically.
Defining Business Services
Perform the following steps in order to define a new Business Service:
-
Select from the top-level menu and push New Business Service.
-
Fill in a Name for the Business Service, select a Customer, and push the Create button.
-
Select the newly created entry from the list and choose Open. The Properties tab opens.
Select a System Role from the drop-down lists.
The value of the Customer only defines to whom the Check corresponding to the Business Service is assigned. It also restricts the selection of inbound Checks to this Customer, unless the All Customers flag is set as well.
-
If you want to record Service Availability data for this Business Service, set a flag next to Enter Service Name to record Availabilities.
By default, the Service Name is the same as the Business Service Name, but you have the opportunity to change it.
Set the flag Report Warning as Available if a Warning Business Service shall be considered Up.
-
Fill in a Description.
-
If you want to include Systems and Checks from other Customer as the one selected above, set the All Customers flag.
Only the Users having the Permission View Composite Checks and Business Services / Edit Composite Checks and Business Services for all Customers filled in this field are able to view / modify the Business Service.
-
Push Save. Ignore the pop-up, do not yet set the Business Service active.
-
Select the Design tab.
-
Select one of the Functions and drag it onto the box labeled Business Service: <business_service_name>. A new box appears labeled with the Function type. Select the new box. The Properties pane appears.
-
Fill in the Function Properties:
-
Fill in a Name and a Description in the Function Details part of the Properties pane.
-
If you want to defer check status propagation, set the flag next to Activate Deferral in the Deferral part of the Properties pane.
The Deferral rules are applied after the function is evaluated. For every check status, you can define how long it shall be considered as a different check status.
Choose a value from the list in Deferral Value (i.e. the evaluated check status) you want to defer, fill in a value (in minutes) into During, and choose a value from the list in To. Use the and buttons to add or remove Deferral rules.
-
You can define a Result Message for the Function. By default, there is no Result Message propagated. You can choose to pass a generated Result Message as a check message. Or you can define your own messages for each possible check status.
If you do not want to pass any Result Message, clear the flag next to Send Result Message to Parent.
-
Push the Apply button at the top of the Properties pane.
-
-
If you want to add another Function as inbound for the recently created Function, drag the corresponding type onto the recently created Function and repeat Step 10.
-
Add inbound Checks either by using Check Selectors, System Selectors (i.e. use the System Status), or directly. Of course, you can even mix those methods:
- Using Check Selectors
-
-
Drag the appropriate Check Selector (i.e. RTM, Daily Check Detail, or Daily Check) onto the function you want to define inbound System Status for. A new box appears labeled with the Selector type. Select the new box. The Selector pane appears.
-
Fill in a Name and a Description in the Selector pane.
-
Set the flag next to 'Check' search criteria in order to define the search criteria.
Select a criterion from the drop-down list. Select or fill in the appropriate values.
You may add further criteria by simply selecting them from the list. All selected criteria are combined using Boolean And, i.e. only those Checks matching all criteria are returned by the Check Selector.
-
If you want to combine the Check Selector with a System Selector then activate Define systems to select check from option and to define a System Selector (see below).
-
You can also choose to pass a generated Result Message to the parent Function.
-
Push the Apply button. Afterward, you may push the Test button in order to verify your Check Selector.
-
- Using System Selectors
-
-
Drag the appropriate Selectors onto the function you want to define inbound System Status for. A new box appears labeled with the Selector type. Select the new box. The Selector pane appears.
-
Fill in a Name and a Description in the Selector pane.
-
Set the flag next to '<system_type>' search criteria in order to define dynamic search criteria.
Select a criterion from the drop-down list. Select or fill in the appropriate values.
-
If you want to add nested criteria, set the flag next to '<nested_system_type>' search criteria and repeat the previous step.
-
By default, the System Selectors only include Systems having monitoring turned on. If you also want to include Systems with monitoring turned off, set the flag Include Systems with Monitoring turned off.
-
Do no longer use the Select Checks option. It is deprecated and replaced by Check Selectors. The option is only available for compatibility purposes and may be removed in future releases.
-
You can also choose to pass a generated Result Message to the parent Function.
-
Push the Apply button. Afterward, you may push the Test button in order to verify your Selectors.
-
- Direct Input
-
-
Drag the appropriate System (for an inbound System Status) or a Check from the tree Input Systems/Checks onto the Function you want to define the inbound check status for. A new box appears labeled with the System and Check. Select the new box. The Properties pane appears. You can use the filter box above the tree display to look up a check more quickly.
-
Fill in a Name for the Server Details or Check Details.
-
You can define a Result Message. By default, there is no Result Message propagated. You can choose to pass the inbound check message. Or you can define your own messages for each possible check status.
-
Push the Apply button.
-
-
Repeat the previous steps until you have all Functions, System Selectors, or direct Checks available.
-
Push the Verify button in order to check the Business Service for consistency and completeness. The Verification Result pane will appear at the bottom including a list of issues, each of which has a severity (
OK,WARNING, orERROR) and a Show button. Make sure that you resolve at least the issues withWARNINGandERRORseverity. -
Push the Evaluate button in order to evaluate the Business Service with real-life data. The result will look like in the image below:
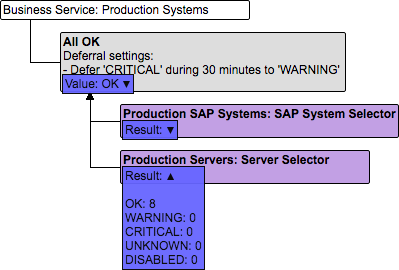
You can click on the triangle for more details. You can even override the computed values (in the Value boxes) for debugging purposes and re-evaluate.
There is also more detailed information in the Verification Results pane at the bottom of the page.
-
Push the Save button. A pop-up will ask you whether to activate the Business Service now. If so, set the Set Business Service to active flag and push the OK button. Otherwise, push only OK.
Once activated the Business Service will be evaluated periodically and displayed in the RealTime Monitoring.
You need the Permission View Composite Checks and Business Services in order to view a Business Service and the Permission Edit Composite Checks and Business Services in order to modify or delete a Business Service.
Defining Composite Checks
Perform the following steps in order to define a new Composite Check:
-
Select from the top-level menu.
-
Push the New Composite Check button and fill in a Name for the Composite Check.
-
If desired, select a Customer.
In case you select a Customer, only Systems of this Customer (and its descendants, in case a Customer hierarchy is used) are considered. Also, a User needs to have the Permission View Composite Checks and Business Services / Edit Composite Checks and Business Services for the named Customer in order to view or modify the Composite Check.
If you leave this field empty, Systems of all Customers are considered, but one needs the Permission View Composite Checks and Business Services / Edit Composite Checks and Business Services for all Customers in order to view or modify the Composite Check.
-
Select a System Type. Push the Create button.
-
Select the newly created entry from the list and choose Open. The Properties tab opens.
-
If you want to record Service Availability data for this Composite Check, set a flag next to Enter Service Name to record Availabilities.
By default, the Service Name is the same as the Composite Check Name, but you have the opportunity to change it. Set the flag Report Warning as Available if a Warning Composite Check shall be considered Up.
-
Fill in a Description.
-
Push Save. Ignore the pop-up, do not yet set the Composite Check active.
-
Select the Scope tab in order to define the set of Systems the Composite Check is to be executed on.
-
Set the flag next to '<system_type>' search criteria in order to define dynamic search criteria.
Select a criterion from the drop-down list. Select or fill in the appropriate values.
-
If you want to add nested criteria, set the flag next to '<nested_system_type>' search criteria and repeat the previous step.
-
Push the Test button in order to verify your Scope Selection.
-
Push Save. Ignore the pop-up, do not yet set the Composite Check active.
-
Select the Design tab and continue as described starting at Step 9 of Procedure: Defining a Business Service.
You need the Permission View Composite Checks and Business Services in order to view a Composite Check, and the Permission Edit Composite Checks and Business Services in order to modify or delete a Composite Check.
Extending by Externally Managed Checks
| This function is only available with the Avantra Pro Edition. |
Externally Managed Checks are an alternative to Custom Checks to pass custom Check data into Avantra. They differ from Custom Checks as described in the following section.
Difference of Custom Checks compared to Externally Managed Checks
Custom Checks are executed by the Avantra Agent, whereas Externally Managed Checks are pushed into Avantra by an external trigger. Custom Checks work with a pull concept, i.e. the Avantra Agent actively retrieves the Check Result.
Custom Checks can be run as Daily Checks, whereas Externally Managed Checks can only be pushed into RealTime Monitoring.
There are many different types of Custom Checks; they can be thought of as a toolbox. There are only two types of Externally Managed Checks, External Status, and External Event. They are described below.
From a networking perspective, Externally Managed Checks can be pushed from any network location which has access to Avantra UI either by using the Avantra UI Web Service directly or by the command line executable provided to access the Web Service.
|
The external source has to make sure that names of Externally Managed Checks are unique within the Avantra installation. You may want to use some kind of naming convention. |
Types of Externally Managed Checks
There are two types of Externally Managed Checks, External Status and External Event. Both types have a check status and check message; the latter one can be either plain text or HTML. The External Status type is handled the same way as other Checks in Avantra: It remains in its check status until the status is changed. When it is updated with a new check status, the previous check status and message will be written to the RealTime Monitoring history. The external trigger is solely responsible for the Check to be updated.
The External Event also has a check status and check message, which must be supplied on create time. However, an External Event Check cannot be updated anymore and there is no history kept. It will be automatically deleted after 60 minutes, or after a period of time defined upon creation.
|
In order to make sure an External Event can be processed by the Notification management, the minimum expiry time is 5 minutes, even if you define smaller values. |
Using Avantra CLI to Push Externally Managed Checks
Avantra CLI is a program to interact with the Avantra Web Service. It includes a command to push Externally Managed Checks. See also How to use the Avantra Web Service by Command Line Executable.
See the examples below of how to call avantra in order to push Externally Managed Checks.
|
To uniquely identify the system which will receive the external checks, the Avantra system ID is required. You can look up this ID in the detail area of the system in Avantra UI or you can fetch the ID using |
- Push an External Status Check Result with Check Status
OK
avantra extern-status -id 42 -status OK -name "My External Check"
-message "See how I can push results to Xandria RTM"
- Push an External Status Check Result with Check Status Warning and HTML Check Message
avantra extern-status -id 42 -status WARNING -name "My External Check" -message "<html><body><h1>See the Result as Heading</h1></body></html>"
- Push an External Event Check Result with Check Status Critical 30 minutes expiry time
avantra extern-event -id 42 -status 1 -expiry-time 30 -name "My External Event" -message "This event based check will be automatically deleted after 30 min"
You need the Permission Edit Systems in order to create and update Externally Managed Checks.