Performance charts
The Performance charts page is available in the NG-UI and lets you build a personal, private set of charts showing system metrics. Charts are visible only to you and cannot be shared with other users.
To open this page, navigate to Monitoring > Performance in the left-hand menu.
Adding a chart
- Click Add new.
- Select a System type.
- Select a System.
- Select a Chart type.
- Click Add.
The chart is added and displayed using the currently active date range. The date range is applied globally and affects all charts you have created.
Modifying a chart
To access the options for a chart, click the ![]() chart menu icon. Three actions are available:
chart menu icon. Three actions are available:
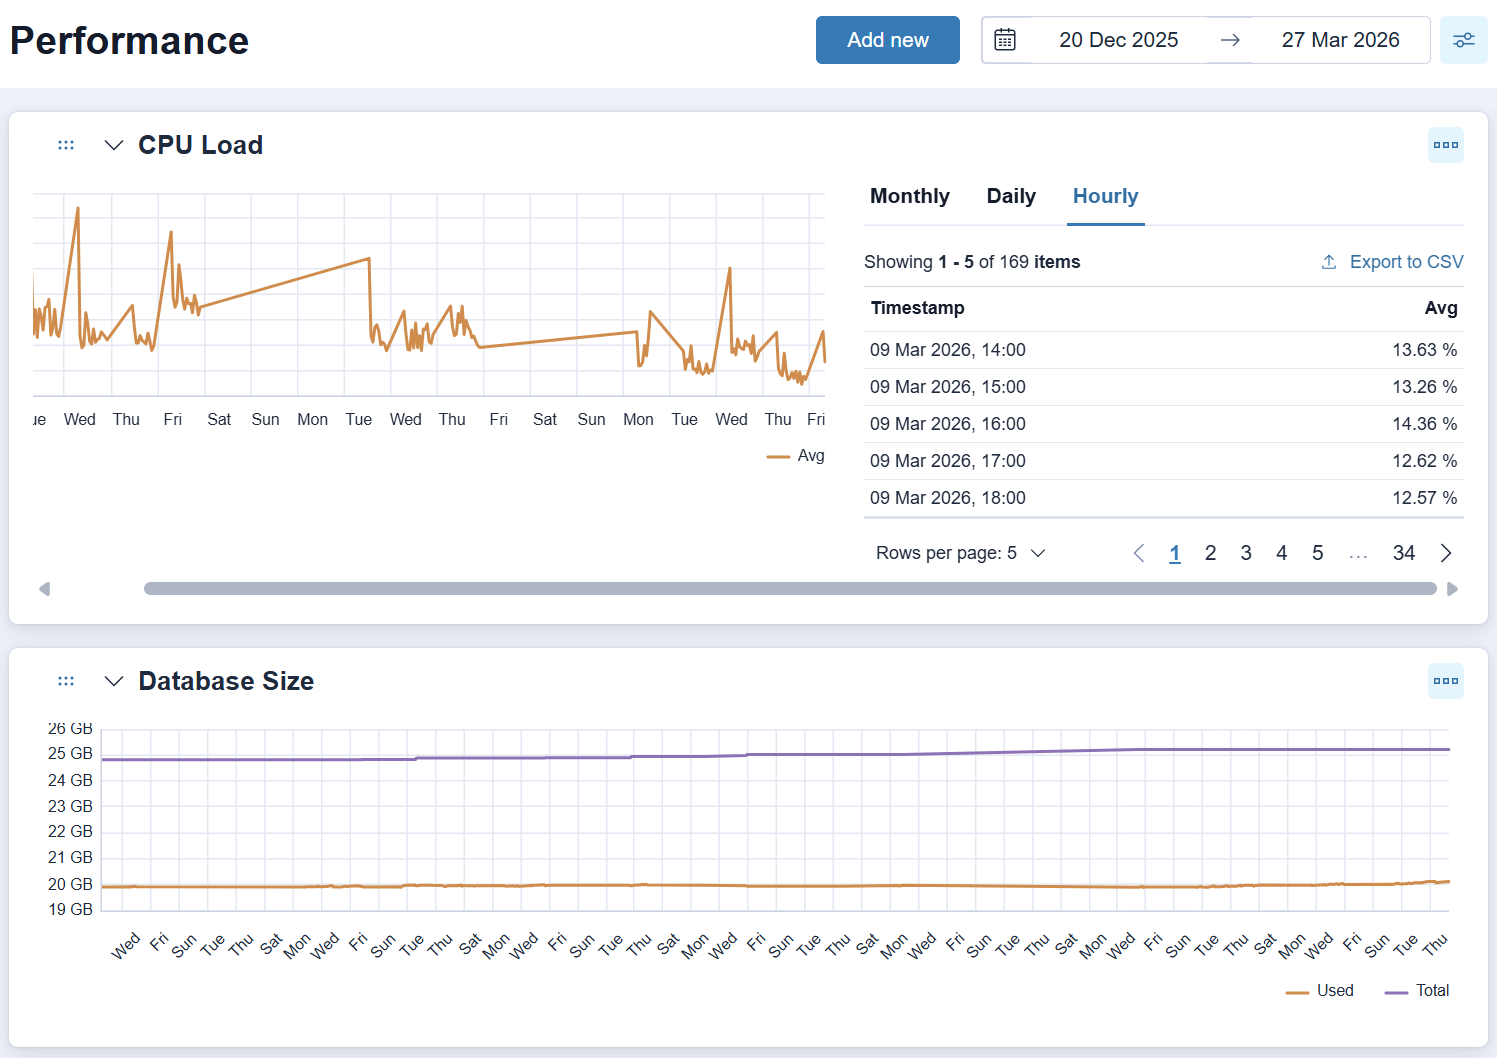
- View data, which opens a data table for the chart. Set the display to Monthly, Daily, or Hourly, then click Export to download the data as a
.csvfile. The export reflects both the selected display interval and the global date range. - Edit, which allows you to update the System type, System, and Chart type. Click Save to apply your changes.
- Delete, which removes the chart permanently.
Chart settings
Click the ![]() settings icon to set the Density and Timezone for your charts. These settings are applied globally across all charts.
settings icon to set the Density and Timezone for your charts. These settings are applied globally across all charts.
Density controls the granularity of data points displayed on the chart. The available options are:
- Finest: Displays data at the highest available resolution, using the shortest interval at which data was collected.
- Hourly: Aggregates data into one-hour intervals.
- Daily: Aggregates data into one-day intervals.
- Monthly: Aggregates data into one-month intervals.