Glossary
A
Activation
Activation is a part of the License request and refresh process.
As soon as you have requested and applied a License it's automatically activated. Also, the activation process runs automatically every 12 hours and it must be successful at least once per 30 days. After 30 days without activation, the server will stop (global monitoring downtime). Each activation gives you 30 days to run Avantra. The Avantra Server contacts our activation servers at https://api.avantra.com, https://api.syslink-xandria.com, and https://api.syslink.ch, and it considers the proxy definitions in HttpProxyHost (or LicenseActivationHttpProxyHost) and the related settings.
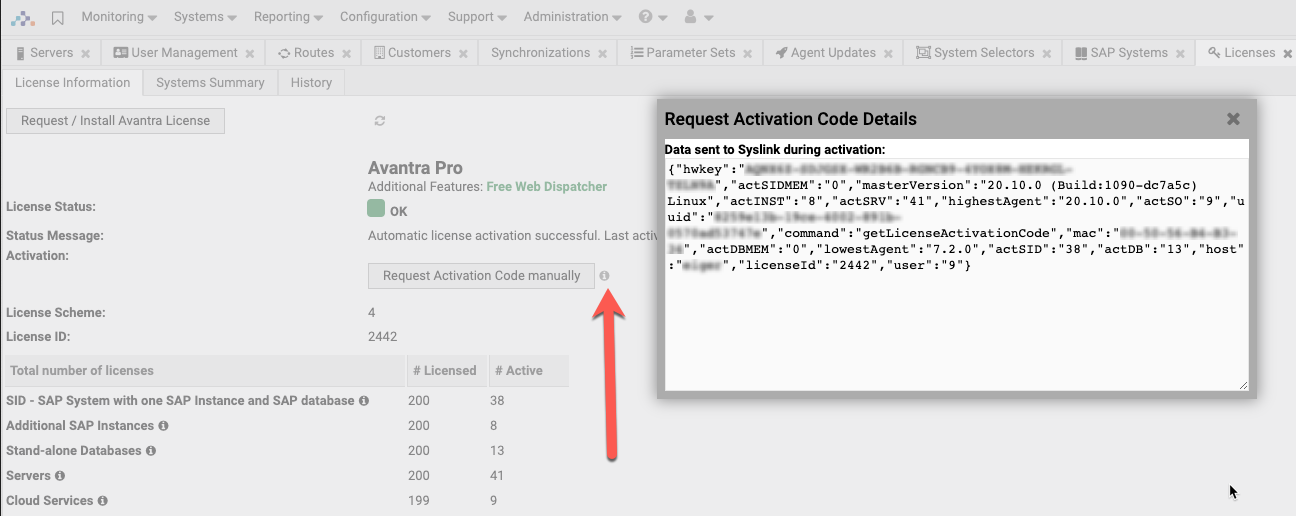
If your Avantra Server is not connected to the Internet, you have to perform this periodic activation manually using your browser (Administration Licenses, Request Activation Code manually). There will be a warning displayed in the Avantra UI three days prior to the expiration of the activation code.
You can find the detailed information about the activation data by clicking the info icon next to Request Activation Code manually on the License Information in Administration > Licenses.
Agentless Monitoring
Agentless monitoring or Remote Monitoring in Avantra is a powerful way to monitor and manage objects within your landscape where you are unable to install an Avantra Agent on the host in question. This is particularly useful for scenarios such as "Rise with SAP" or "HEC" implementations where the customer (and/or service provider) retain responsibility only for the application layer (client 000 and above). Avantra supports Agentless monitoring for:
- SAP Systems and Instances
- Databases
- Cloud Services
Agentless Monitoring means another agent located close enough from a network perspective will take over the management of the object and will access the monitored components over the network only. The only prerequisite is the Avantra Agent performing Agentless Monitoring is allowed to connect to the SAP Instances and Databases. Please make sure no firewalls on either host or network level are preventing this access.
Agent Self Updates
The Avantra Agent contains self-updating functions that facilitate the updates deployment process. Update packages can be copied to the web server included in the Avantra Server. Once you trigger the update (centrally, for one or multiple Physical Servers), the Avantra Agent will download the package from this location (transparently through any Avantra Gateways eventually used) and afterwards update itself.
Application Type
Application Type is one of the attributes and the standard grouping mechanism found in every system in Avantra.
Default application types are:
- Generic
- SAP R/3
- SAP BW
- Utilities
- SAP CRM
- SAP Workplace
- SAP APO
- SAP R/3 Enterprise
- SAP NetWeaver
Other application types can be defined as well.
Auto Discovery
In Avantra, SAP Instances and SAP System Databases are discovered automatically. You only need to install Avantra Agents on all Servers hosting SAP Instances and SAP System Databases, and to define the SAP Systems and Servers within the Avantra UI. The rest is done automatically.
If an SAP Instance is no longer discovered on any Avantra Agent, it's flagged with the ![]() icon, and monitoring is turned off. After RemoveFromDBDelay days the SAP Instance is removed from Avantra.
icon, and monitoring is turned off. After RemoveFromDBDelay days the SAP Instance is removed from Avantra.
Automated Kernel Upgrade
The purpose of the Automated Kernel Upgrade feature is to automatically upgrade SAP kernels relieving SAP administrators of many tedious activities. For more information, refer to Automated Kernel Upgrade.
Avantra Agent
The Avantra Agent is the part of the Avantra architecture that actually performs monitoring and management tasks. You will probably have multiple Avantra Agents installed in your environment.
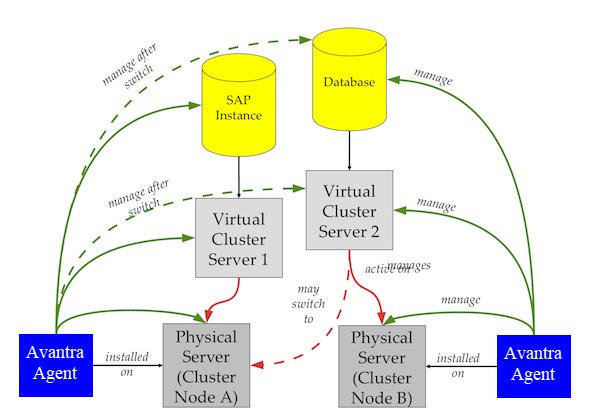
The Avantra Agent is supposed to run on every physical server hosting a system that Avantra is supposed to manage. The Managed Object can be the physical server itself, any virtual cluster server eventually hosted, a Database or an SAP Instance installed on either the physical server, the virtual cluster server, or both.
The Avantra Agent runs as a service (on Microsoft Windows operating systems) or as a daemon (on Unix-like operating systems). Its main purposes are to:
Perform all the Checks described in sections Server Checks, SAP Instance Checks, SAP System Checks, and Custom Checks
- Perform Auto Discovery of SAP Instances
- Verify and track availability data for Server, SAP Instance, and Database
- Collect SAP Instance and Database profiles, as well as SAPDBA/BR*Tools logs
- Detect and track the changes of the System Change Auto Detection process
- Send Check Results, SAP Instance data, Availability Data, Changes, and profile data to the Avantra Server
- Perform Self Updates on demand
- Deploy, maintain, and run custom scripts or programs as Checks, if desired
- Periodically connect to the Avantra Server to tell if it's still alive
- Collect and aggregate Performance data
- Listen for configuration data and special commands sent by Avantra Server
Configuration of the Avantra Agents is kept centrally in the Avantra Database and is transmitted to the Avantra Agent whenever configuration items change. Data sent to and from the Avantra Agent is encrypted using HTTPS.
Avantra Database
Avantra recommends the use of PostgreSQL Relational Database Management Systems (RDBMS) in order to store all data. Customers can also use Microsoft SQL Server (on Microsoft Windows operating systems) for smaller deployments.
The Avantra Database runs on the Avantra Server (or on a separate host) and can be accessed using the Avantra WebUI. There is no direct connection between any Avantra Agent and the Avantra Database. Database backups can be dumped to the filesystem and thus can be picked up by an ordinary filesystem backup.
Avantra Gateway
If your network is configured in a way that the Avantra Agents cannot connect directly to your Avantra Server, you might consider using an intermediate Avantra Agent as a Gateway to the remote Agents.
The intermediate Agent must be installed on a host which is reachable from the other Avantra Agents as well as from the Avantra Server. It is also possible to cascade multiple Agents as Gateways if necessary.
Avantra Server
The Avantra Server is one of the most central and important components of Avantra. It is the communication peer of the Avantra Agents, i.e. it receives Check Results and other data provided by the Avantra Agent.
Avantra Server performs the following tasks:
- Permanently listens on TCP port 9050 (unless configured differently) in order to receive and accept data from any installed Avantra Agent
- While processing the received data, it also
- updates Check Status and Check Message of RealTime Monitoring Checks
- stores Daily Check data, SAP client, SAP license, and SAP version information, as well as profile parameters, Availability Data, Performance Data, etc.
- creates Changes for modified SAP Instance or Database profiles; some actions performed with SAPDBA or BR*Tools (Oracle databases only), SAP kernel changes, SPAM changes, system change option (transaction SE06) changes, etc.
- Maintains a persistent connection to the Avantra Database
- Periodically verifies if all known Avantra Agents are running. This is done by maintaining a list of all Avantra Agents and a list of timestamps of received data. If there was no data received during AliveTimeout minutes, a Critical AGENTALIVE Check Status is generated
- Periodically verifies the integrity of the defined SAP Systems and SAP Instances, and maintains the SystemAlive Check Status based on the RFCCONNECT, J2EECONNECT, ASCS_MSGSRV, SCS_MSGSRV, and the DBCONNECT Checks.
- Evaluates Composite Checks, Business Services, and schedules Maintenance Windows and Parameter Sets
- Processes Notifications
- Ships the configuration changes made in Avantra WebUI to the Avantra Agents.
Most of the configurations of the Avantra Server can be performed using the Avantra WebUI. Only the access data for the Avantra Database is required to be configured in a text file.
The Avantra Server runs as a service (on Microsoft Windows operating systems) or as a daemon (on Unix-like operating systems).
Avantra UI
Avantra UI is the web-based user interface to Avantra. Almost all configuration and operation tasks of Avantra are performed with this interface. Depending on the user permissions you have, many of the functions provided by the Avantra UI may be read-only or not available at all.
Being a web application, Avantra UI can easily be deployed in a way that both internal staff (i.e. representatives of the Service Provider operating Avantra) and Customers have access to it. Avantra UI uses the Jetty HTTP server and Java Servlet container.
The technical name of Avantra UI used, for example, with file names/directories, executable files, log files, and installer packages is xangui.
Availability Tracking
Avantra allows collecting and managing the data about the monitored systems' availability. Availability Data is collected for Servers, SAP systems, SAP instances, Databases, SAP BusinessObjects, and Cloud Services.
B
Basis Releases Supported for SAP Systems
The Avantra Agent monitors the following SAP Basis Releases:
- Releases 4.6C, 4.6D
- Release 6.40
- Releases 7.0x, 7.1x, 7.2x, 7.3x, 7.4x, 7.5x, 7.7.x
Unicode Kernels are supported as well.
SAP BusinessObjects System
The BusinessObjects system type in Avantra lists systems which are SAP BusinessObjects Business Intelligence systems. We support BOBJ systems from version 4.2 onward. These systems include checks to manage system uptime, performance, and job execution. A standalone database system type must be defined before adding a BusinessObjects system.
The Business Object system type does not include SAP BusinessObjects Data Services (BODS). These systems are quite different as their underlying technology does not allow the same methods for monitoring.
Business Service
A Business Service is a cross-system (and even a cross-customer) Composite Check. In other words, while input checks of a Composite Check must be executed on a system for which the Composite Check is defined, a Business Service can have arbitrary input checks.
And although every Business Service is “owned” by a customer, it may have input checks from other customers as well. Input checks for a Business Service can be a Built-in Check, a Custom Check, a Composite Check, a System Status, or another Business Service. Business Services also record Availability Data.
An example for a Business Service would be to correlate all SystemAlive Checks of all productive SAP Systems. A Business Service is a Managed Object as well as a Check, so you can apply Maintenance Windows to it, for example. And, of course, a Business Service has a Check Status.
C
(SAP) CCMS Integration
Avantra can interface with the SAP CCMS (Computing Center Management System) and include CCMS Monitoring Tree Elements as RealTime Monitoring Checks.
The definition can even be on the “CCMS Monitor” level, integrating all the “Monitoring Tree Elements” below as single Checks.
CCMS Alerts
CCMS Alerts will be acknowledged automatically in the SAP System (optional) once they are imported into Avantra. You can verify them using Avantra UI, forward them using Notifications, and delete them afterwards. In addition, “CCMS Monitoring Tree Elements” can be read and configured centrally. Integration and configuration are implemented by means of Custom Checks.
Change Management
Avantra provides a built-in Change Management solution allowing Customers to request changes on their Systems. Many of the System changes are recorded automatically using System Change Auto Detection.
Check
Monitoring in Avantra is performed by execution of the so-called Checks performed by Avantra Agent and Avantra Server.
The list of executed Checks varies depending on the System Type:
- Physical Server
For a Physical Server, it's verified if the server is available, and the most important operating system conditions are checked.
All Checks for a Physical Server are executed by Avantra Agent installed on the Physical Server itself. - Virtual Cluster Server
For a Virtual Cluster Server, the main focus is to detect cluster switches. This Check is performed on all Physical Servers that may run the Virtual Cluster Server. - SAP Instance
For an SAP Instance there are different types of connection checks depending on the instance type, and also some checks for the health conditions of the application server, first of all in the Java area.
All Checks for an SAP Instance are executed by Avantra Agent installed on the Physical Server hosting the SAP Instance, either directly or via a Virtual Cluster Server. - SAP System
For an SAP System, there are basically three groups of checks:- Verification of the health status of the Database instance, like different space consumption checks for the Database itself and the transaction logs and backup checks. The Database-dependent SAP System checks are executed on the host running the Database instance.
From a monitoring perspective, the Database Checks of a Database instance are considered SAP System Checks.
- Database-independent health conditions, like the status of the updater, output request errors, short dumps, aborted jobs, etc. All Database-independent SAP System Checks are executed on the host running the SAP Instance identified as “central”, i.e. the Central or Central+Java SAP Instance, or one chosen by Avantra (for Java-only systems or ASCS installations).
- Specific Checks for certain types of SAP applications, like SAP BW/BI, SAP XI/PI.
- Standalone Database
For standalone Databases, the same Checks are executed as for Database instances of an SAP System.
Every check provides a Check Result under consideration of the results of the Root Cause Analysis.
Check Confirmation
RealTime Monitoring Checks and Daily Checks can be confirmed and unconfirmed by an administrator in order to document that all issues eventually brought up by the Check have been followed up.
Check Cycle
Checks are executed in different Check Cycles, and the list of checks executed depends on the System Type. The Check Cycles are:
| Cycle | Description |
|---|---|
| Basic | The Basic Check Cycle is scheduled by Avantra Agent every 5 minutes (by default). During the Basic Check Cycle all Checks for Physical Servers, Virtual Cluster Servers, SAP Instances, and Databases are executed. Checks executed in the Basic Check Cycle are part of the RealTime Monitoring. |
| Medium | The Medium Check Cycle is scheduled by Avantra Agent every 10 minutes (by default). During the Medium Check Cycle, all checks for SAP PI/XI are executed. Checks executed in the Medium Check Cycle are part of the RealTime Monitoring. |
| Full, Daily | The Full Check Cycle (or Daily Check Cycle) is scheduled by Avantra Agent every 24 hours. As the name indicates, the Checks executed during this Check Cycle are the so-called Daily Checks. |
Check Status
Every single check has a particular check result after being executed. The result is composed of two parts:
- The check status
- The check message.
While the check message is some free text (and in a very few cases can even be empty), e.g. WARNING — 'xyz' is used by 35.1%, the check result in any case is one of the following:
| Status | Description |
|---|---|
| Ok | Everything is working as expected. |
| Warning | Either a warning threshold has been exceeded, or a system condition was met that should be followed up, but is not an error condition. In some cases, checks that cannot be performed — although they are supposed to — also report a warning result. |
| Critical | Either a critical threshold has been exceeded, or an erroneous system condition was met. In some cases, checks that cannot be performed — although they are supposed to — also report a critical result. |
| Unknown | The check result cannot be determined. In most cases, this check result is an effect of the Root Cause Analysis. |
| Disabled | The check has been disabled intentionally, or the check is not executed on the system (within Daily Checks). |
Check Selector
A Check Selector is a logical grouping of Checks within Avantra. They define a group of Checks to be used in RealTime Monitoring, Notifications, and Business Services.
A Check Selector can group either RealTime Monitoring Checks, Daily Checks, or both. The group of Checks to select from the Check Selector can be defined by attributes as defined by you.
Is also possible to limit the selected Checks to a well-defined set of Monitored Systems using Check Selectors.
Cloud Services
Avantra provides the Cloud Service object type for integration with Software-as-a-Service (SaaS) solutions. Most SaaS solutions provide an API, and Avantra can work with them through the SAP Cloud Service object type. Knowing the solution's API allows getting the required information, like errors, malfunctions, failures, etc., out of the product and then using it as a basis for Checks. Avantra proposes the following integration methods:
- Generic - supports various authentication methods and enables you to integrate with any SaaS solution with disclosed API. The generic integration will be used with the RUN_JS Custom Check type and the JavaScript-based Custom Check API. There are examples available in our knowledge base at Avantra Support.
- Dedicated - simplifies the setup and provides out-of-the-box support for business-relevant checks. The Avantra team develops and configures all necessary Checks, so you can use them for monitoring purposes immediately without needing to go through the configuration process. However, you can always create new or tweak the existing checks as you see fit.
Avantra supports SAP Cloud Connector Integration, SAP Cloud Platform Integration, and SAP Cloud Platform Neo. Other integrations, like Ariba, SuccessFactors, Concur, etc., are planned.
Composite Check
A Composite Check is a Check that is composed of one or (usually) more other Checks. This can be either built-in Checks, Custom Checks, or other Composite Checks. Roughly speaking, a Composite Check is an evaluation rule that determines a Check Result based on the Check Results of its input Checks.
Similar to Custom Checks, Composite Checks can be defined for a Static Group or a Dynamic Group of Systems. The evaluation of the Check Result is performed by Avantra Server.
Composite Checks also record Availability Data. The SystemAlive Check is an example of a built-in Composite Check (which cannot be modified).
Custom Attributes
Avantra allows you to define Custom Attributes to fulfill your business needs. These attributes can be defined for any of the monitored object types (e.g. Server, SAP System, SAP Instance, BusinessObjects, Database, Cloud Service).
Additional attributes you define will become visible and can be populated in the System details dialog. They can also be used in Selectors.
Although not shown by default, you also have the option to show Custom Attributes in System lists. You can use the list configuration action to display the Custom Attributes in System lists.
Custom Attributes can also be used in Notifications Output Channels.
Custom Check
Monitoring can be extended by the so-called Custom Checks. Custom Checks are provided in order to:
- monitor the SAP R/3 system log, your specific SAP Jobs, or certain SAP transaction run-times
- execute your own ABAP reports as Avantra Checks
- verify uploads to your SAP BW/BI systems
- verify RFC destinations
- integrate with the JMX (Java Management Extensions) monitoring tree of either the managed SAP System or any other Java Application Server
- monitor processes or services (on Microsoft Windows operating systems) and dedicated filesystems
- monitor file interfaces or check network response times
- monitor Web sites, including basic authentication, form handling, certificate expiration, and response
- deploy and run your own scripts or programs as Avantra Checks (sort of plug-ins)
- monitor arbitrary log files and the Microsoft Windows EventLog for certain patterns
- integrate with and configure the SAP CCMS, either a single monitoring tree element or a whole monitoring tree
- monitor Disk I/O and Network I/O
- verify the values of profile parameters, the status of Java components, and the active ABAP and Java users in an SAP System
Similar to the Monitoring Parameter Sets, Custom Checks can be defined for a Dynamic Group or a Static Group of Systems.
Many of the Custom Checks listed above are also capable of tracking and recording the so-called Service Availability. Custom Checks — as the name indicates — need to be manually configured.
Custom Monitoring Parameter
Custom Monitoring Parameters are an extension to Custom Checks. There may be cases where the built-in Monitoring Parameters do not provide the necessary information you want to use in a Custom Check, or where a single customizable setting would save you from duplicating Custom Check definitions.
You first have to define Custom Monitoring Parameters on an application-wide level with a System Type they are bound to, the unit, and a default value. This default setting is then known to all Avantra Agents connected. If the default value does not suit in all cases, you can change the Custom Monitoring Parameter on a per-System level or within a Parameter Set – like a normal Monitoring Parameter.
Custom Monitoring Parameter names have to start with the cust. prefix.
Customer Application
A Customer Application is a grouping mechanism for Systems consisting of a Customer and an ApplicationType.
Customer Overview
Whether using Avantra as a single-tenant installation or multi-tenant, the customer setup is an important part of your Avantra installation. Avantra has been developed since the start from a Service Providers perspective and is at the core of all functions.
A customer makes a lot of sense for a service provider where there are literally different customers configured in the system and it's a logical separation of monitored objects, for single enterprises this can still be a very useful concept especially if you are dealing with different business units or entities that require logical separation.
Customers “own” the Systems contained within them. In other words, Systems are grouped by Customers within Avantra, where by default no representative of Customer A has the permission to access any data of Customer B. Similarly, other Managed Objects are “owned” by Customers.
Customers may be arranged hierarchically in order to allow inheritance of Permissions. On top of this hierarchy, there is a so-called root customer which cannot be modified and cannot own Systems, but which can be used to assign Permissions to. In other words, users who have permissions on a top customer get the same permissions also on all contained sub-customers. For example, this can be very useful for international organizations, where systems are grouped into different geographical locations.
D
Dashboard
A Dashboard in Avantra is a page in the UI you can customize to your liking. It features the positioning of the so-called Dashlets in either a fixed or a floating grid layout.
Dashboards may be private to a User or shared between all Users of a given Customer. There is also an option to open a Dashboard outside of the UI by a direct URL.
Database
A (Relational) Database Management System of the following types:
- SAP HANA
- SAP ASE (also referred to as SAP Sybase ASE)
- SAP IQ
- SAP SQL Anywhere
- SAP MaxDB (also referred to as SAP DB)
- Microsoft SQL Server (also referred to as MSSQL server)
- IBM DB2
- Oracle
- PostgreSQL
- MySQL and MariaDB
This can either be a standalone Database or a database instance of an SAP System‚ or a liveCache, etc.
A Database is hosted by exactly one Physical Server or Virtual Cluster Server, but multiple Databases can be hosted on the same server.
If you want to manage or monitor a Database, you need to manage or monitor the Physical Server or the Virtual Cluster Server the Database is hosted on.
From a license perspective, it depends if a Database is the primary Database of an SAP System or not. If yes, the license is included in the SAP System's license. If not, a separate Database license is required. The only exception is the System DB of an SAP HANA database which does not consume a license
Daily Check
In addition to RealTime Monitoring, Avantra also checks certain system conditions of an SAP System or a Database only once per day. Among these, there are, for example, Checks for a backup (which you usually perform once a day only) and others. We call this kind of checks Daily Checks. They are also referred to as Full Checks.
You may want to skip the execution of Daily Checks on the weekends using Monitoring Parameter RunDailyCheckOnWE.
You can also restrict the Daily Checks details to those parts that are relevant for you using the SAP System or Database Monitoring Parameter RelevantDailyCheckDetails.
E
End-to-End Application Monitoring
Avantra usually performs management and monitoring locally on the Systems. But there is also an option to monitor SAP Systems and, for example, web servers from a user perspective.
So-called End Points can be defined on any physical server that has the Avantra Agent installed, allowing system monitoring, availability and performance recording from a user perspective (even from remote sites).
In contrast to some other system management products, and in order to keep things really simple, you should not define End Points on End-User PCs, but have a single Physical Server with Avantra Agent installed on every remote site. There is no SAP GUI or web browser instrumentation with Avantra.
End-to-End Application Monitoring includes RealTime Monitoring checks, performance monitoring of connection response times, availability recording (from the End Point perspective). It can be defined for both, ABAP and Java stacks, but also for general purpose web servers. For ABAP stacks there is also the opportunity to run ABAP reports that may simulate certain typical user transactions.
Every End Point needs to have an Avantra Agent installed to execute End-to-End Application Monitoring. You can either use any existing Avantra Agent you may have placed in the remote site already, or you install another one.
Externally Managed Checks
Externally Managed Checks are Checks within Avantra that have their Check Result pushed from an external source by means of the Web Service.
There are two different incarnations of Externally Managed Checks: External Status and External Event. In the Avantra Classic UI, once an external status is created, it will keep its original status for 3 days, and then will display a warning icon adjacent to the status. In the Avantra New UI, there is no such warning icon. In both, the last update received will be displayed.
Like usual Checks, Externally Managed Checks can be used within the Notifications.
F
Forecasting
Avantra includes a feature called forecasting which is implemented for many Avantra Checks, where possible. A check requires a resource to be monitored, i.e. something where usage in percent of the maximum available resource space can be calculated.
An example of such a resource-related check is the FILESYSTEMS check. A file system has a size and an amount of space that is used. Therefore, the usage in percent is calculated. Now if the used space of a file system grows fast, but is still below the usage thresholds, the used space may be filled very quickly so it may be hard to react in time before the usage threshold related check will give you a Warning status.
Forecasting takes the job to inform you of heavy resource consumption before the resource is full. It will use the previous usage values to interpolate into the future, how long it will take – assuming the usage will continue to grow uniformly – until the resource space available is exhausted. Similar to the two Warning and Critical usage thresholds, each check has two thresholds for forecasting: a Warning (…ExWarn) threshold with a default value of 12 hours, and a Critical (…ExCrit) threshold with a default of one hour. To interpolate into the future, forecasting will always take the usage values of half of the exhaustion threshold past from now, so per default, it will look 30 minutes back for the Critical threshold.
An issue with forecasting is to prevent false alerts, so a growing resource needs to be growing for a certain time, otherwise, a false alert will be reported too often. Additionally, forecasting will be inactive if the usage of a resource is below 50 %.
Forecasting is available for the following checks: ADA_DATAAREA, ADA_LOGAREA, DB2_FSLOGARCH, DB2_LOGUSAGE, DB2_TABLESPACES, FILESYSTEMS, HDB_Disks, MSS_DBUSAGE, MSS_LOGUSAGE, ORA_FSLOGARCH, ORA_TABLESPACES, SYB_DataSpaces, and SYB_LogSpaces.
Forecasting is also available with Performance data for those resources where it's useful. Whenever you select the time range of a Performance chart to extend into the future, the data is extrapolated accordingly. It is also available in the Service Level Reports unless opted-out during generation.
I
Interpolation
Interpolation is a placeholder used in the Notification process in Output Channels and Filter Lists. During the processing of a Filter List or an Output Channel, an Interpolation retrieves a particular value available at runtime. Interpolations are the improved version of Macros which they replace.
The term Interpolation comes from the Apache FreeMarker Template Language (FTL) which is used in the Notification process since Avantra 6. For the sake of consistency and easier reference to FTL, we stick to the terminology used in there.
The major difference between the deprecated Macros and Interpolations: the former one is always a string, the latter one can also be of type boolean, date, time, and others. In other words, Interpolations are strictly typed. However, you can always convert any Interpolation into a string.
More exactly, we had to distinguish between a variable and its value, the latter of which it gets through the process of interpolation. However, for the sake of simplicity, we stick to one term for both.
L
License
You need a valid license in order to operate Avantra. The license is implemented by means of a license file used with the Avantra Server. It basically contains the amount of systems allowed to manage and an Activation Key binding the license to an Avantra Server instance.
Log Adapter
A Log Adapter in Avantra provides log entries of arbitrary log sources as an array of standardized sets of key-value pairs. Log Adapters are used in LogAdapterCustomCheck in order to monitor the content of log files. Log sources can be either textual log files or the Microsoft Windows EventLog. There are pre-defined read-only Log Adapters for the Windows System Event Log, Oracle Alert Log, DB2 Diagnostics Log, etc., but you also can define your own Log Adapters in order to monitor other log resources.
Log files in the context of Avantra are text files recording certain actions in a structured way. There are applications out there that consider dumping an arbitrary amount of unstructured bytes into arbitrary files as logging. You can try to get a grip on these things defining an appropriate Log Adapter, but your mileage may vary.
Technically speaking, you can think of a Log Adapter as a regular expression-based parser using named capturing groups. The result is provided as Macros for use in the LOG_ADAPTER Custom Check, but also in the Monitoring Parameters configuring the Oracle Alert Log or DB2 Diagnostic log checks.
M
Macro
Macros are deprecated. Use Interpolations instead.
Maintenance Window
Maintenance Windows can be used to schedule periods of time during which the monitoring of one or more Systems is turned off.
Even more, you can automatically stop an SAP Instance or an SAP System at the beginning of a Maintenance Window and start it again at the end of it.
Availability Data is recorded even if the monitoring is turned off. And if a system is down during the Maintenance Windows, the downtime is considered as "planned" and does not count for the Service Level Report.
A Maintenance Window can be thought of as a container for Schedules indicating when to turn monitoring off (and on) for a Dynamic Group or a Static Group of Servers, SAP Systems, Databases, and Business Services.
A Schedule is a recurrent or non-recurrent event with a start time and a duration reflecting one or more periods of time. One or more Schedules can be assigned to a Maintenance Window, forming the following relation:
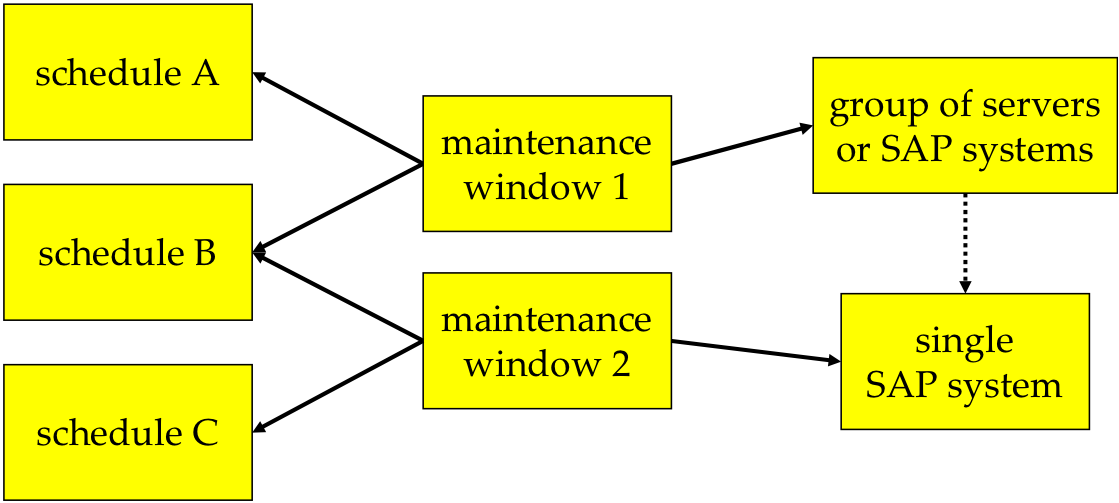
A particular System can be affected by multiple Maintenance Windows, thus Schedules may overlap.
Monitor Level
Monitored systems in Avantra run with a Monitor Level, which determines the checks and actions that can be performed on the respective systems.
Monitor Levels have been introduced with the SAP system auto creation feature (see Defining SAP Systems automatically) and enable a system to be monitored without credentials, by just applying the adequate checks to it.
Monitor Levels are provided automatically by the corresponding agent monitoring the system. The agent calculates the Monitor Level of a system based on the configuration and system data and then performs the corresponding checks.
There are three Monitor Levels for systems in Avantra:
| Connected | No credentials have been configured for the system so far. |
| Authenticated | At least some (or all) required credentials have been configured. |
| Auth. & Deployed | Credentials have been configured and Avantra modules have been installed on the target system (i.e Avantra Transport has been installed). |
Monitoring Exception Parameter
Certain Monitoring Parameters allow the definition of exceptions. If you, for instance, define usage thresholds for a tablespace with a Monitoring Parameter, the defined value is valid for all tablespaces of the system. If you want to override this setting on a per-tablespace level you can define the so-called Monitoring Exception Parameter for the particular tablespace.
Monitoring Exception Parameters can be defined in Monitoring Parameter Sets as well.
Monitoring Parameter
Monitoring parameters are the mechanism for you to configure how your systems are monitored. They are how you set configuration of how the agent runs, how checks are executed, thresholds for checks (when does a check go critical or warning) and much more. All Monitoring Parameters have a carefully chosen default value. As soon as you add a new system, Avantra uses these defaults. You may change these defaults by defining a parameter and by modifying its values. Monitoring Parameters can be defined for a single system, or for collections of systems using Monitoring Parameter Sets. You can also define your own Custom Monitoring Parameters for use within Custom Checks and automations.
N
Notification Element
A Notification Element is an object that can be forwarded by a Notification Action.
The following Notification Elements are available:
| RealTime Monitoring Check Results | A notification of a Check Result may occur when a Check Status changes, or when the Check gets confirmed or unconfirmed, or periodically if it remains in its Check Status for a certain period of time. For certain Checks, like the filesystem or tablespace Checks, a notification will also occur if the Check Status changes for a particular filesystem or tablespace, even if the overall Check Status does not change. |
| Daily Checks | A notification of a Daily Check may occur as soon as the Daily Check execution has finished, and once it gets confirmed or unconfirmed. |
| Daily Check Detail | A notification of a Daily Check Detail may occur as soon as the Daily Check execution has finished. |
| CCMS Alerts | A notification of a CCMS Alert may occur as soon as it's delivered by the corresponding Custom Check. |
| Changes | A notification of a Change may occur as soon as it's created, and whenever the status of the Change record changes. However, this function is most useful for notifications of the System Change Auto Detection. |
| Tickets | A notification of a ticket may occur as soon as a ticket is created, and whenever the status of the ticket changes, or a new ticket log is created. |
| Server Events | A notification occurs once the License is about to expire. |
Notifications
Notification Elements can be escalated to Users having the required permission for the Customer owning the affected System. This process is called a Notification in Avantra.
The escalation via e-mail is supported, and these mails can also be converted to pager notifications or text messages (SMS) by use of third-party applications. In addition, it's also possible to send Notification Elements to virtually any other system monitoring or management application. You can write Check Results into log files or arbitrarily formatted text files, like XML files. Or you can execute any command, write to the Windows Event Log, send XanMobile push notifications, or a browser notification. And finally, you can create Tickets in the ticketing system of Avantra.
The different ways to address a notification are called Output Channels.
The escalation mechanism provided by Avantra is highly customizable by means of, for example, Check selectors and includes powerful Filter rules. These filters allow the precise definition of which content is to be escalated to whom and at which point in time. Common parts of Filters can be shared as the so-called Global Expressions.
The Output Channels and Filters support Macros that are replaced with real-life System and Notification Element data during run-time. You can also define your own Macros and therefore enter third-party data into the Notification process by means of the so-called Custom Resolvers.
The trigger for the different Notification Elements, the selected Output Channel, the Filter Lists, and any custom Resolver form the so-called Notification Action. Whenever a Notification Action is executed the result is kept in a Notification Message. This Notification Message allows you to trace exactly if a notification was sent or if it was blocked by a certain filter, when it was delivered, if it succeeded in the first attempt or needed a retry, etc.
Service Providers may delegate the permissions to generate Notifications to their Customers. In this case, not all Output Channels are available.
O
Operational (System)
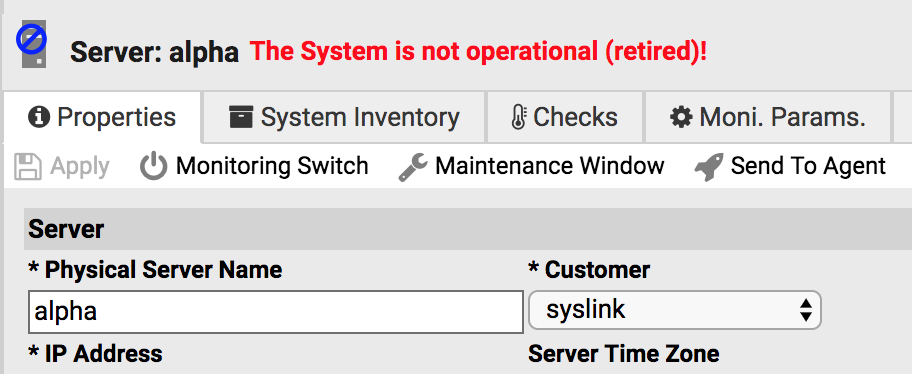
The life cycle of a system comprises a phase when the system is operational. However, there is a time span before the System becomes operational, and there is one after the system is operational. As a general rule, every system defined in Avantra is considered operational, unless it's changed manually.
For this purpose there are two properties for every System Type in Avantra: "Operational since" and "Operational until". If none of these is set (which is the default), the system is operational, and hence it counts for the license.
If there is an "Operational since" date set in the future, or there is an "Operational until" date set in the past, the system is considered not operational.
A system that is not operational is not monitored by definition.
A SAP Instance inherits the operational status from its SAP System.
P
Parameter Set
Parameters Sets are a grouping mechanism for certain properties. A Parameter Set can be applied to a Dynamic Group or a Static Group of Systems.
The properties available for grouping are: Monitoring Parameters, Check Execution, Check Notification, and Monitoring Exception Parameters.
As you can easily see, there may be situations where a certain system belongs to more than one group. If you have the same property defined in two different Parameters Sets sharing a common subset of a system, you have to prioritize the Parameters Sets in order to decide which one is finally effective.
Furthermore, for every Parameter Set, you can define if the definition of a property in a Parameter Set can or cannot be overridden on a per-system level. If cannot, you can define a consistent set of properties throughout a class of the system. But even if you allow overriding, you can re-apply the properties at any time.
Parameters Sets can be scheduled. So, for example, it's possible to have different values for Monitoring Parameters of different periods of time. You may use schedules or service hours to define the validity period of a Parameter Set.
Please prioritize Parameters Sets carefully if they are scheduled!
Performance Monitoring
Parameters Sets are a grouping mechanism for certain properties. A Parameter Set can be applied to a Dynamic Group or a Static Group of Systems.
The properties available for grouping are: Monitoring Parameters, Check Execution, Check Notification, and Monitoring Exception Parameters.
As you can easily see, there may be situations where a certain system belongs to more than one group. If you have the same property defined in two different Parameters Sets sharing a common subset of a system, you have to prioritize the Parameters Sets in order to decide which one is finally effective.
Furthermore, for every Parameter Set, you can define if the definition of a property in a Parameter Set can or cannot be overridden on a per-system level. If cannot, you can define a consistent set of properties throughout a class of the system. But even if you allow overriding, you can re-apply the properties at any time.
Parameters Sets can be scheduled. So, for example, it's possible to have different values for Monitoring Parameters of different periods of time. You may use schedules or service hours to define the validity period of a Parameter Set.
Please prioritize Parameters Sets carefully if they are scheduled!
Performance (Performance Data Collection)
The following Key Performance Indicators are collected, aggregated, and reported:
| System Type | Aggregation | Performance Resource Type | Source |
|---|---|---|---|
| Physical Server | Hourly, daily, and monthly | Total average CPU usage | CPULOAD Check |
| Total disk usage across filesystems | FILESYSTEMS Check | ||
| Total amount of and used virtual memory | PAGINGSPACE Check | ||
| Amount of used physical memory | MEMORY Check | ||
| Network I/O transmitted and received kilobytes | NETWORK_IO Custom Check | ||
| Disk I/O number of reads and writes | DISK_IO Custom Check | ||
| Disk I/O read and written kilobytes | DISK_IO Custom Check | ||
| Network Response time | NW_RESPONSE Custom Check | ||
| HTTP Response time | HTTP_RESPONSE Custom Check | ||
| SAP Instance (ABAP and ABAP+Java) | Hourly, daily, and monthly | Maximum number of concurrent users | Monitoring Tree ActivitySnapshot ActiveUsersCount |
| Daily and monthly | Average dialog response time and number of dialog steps | Daily Check | |
| Average response time and number of dialog steps for named transactions | |||
| Average response time and number of dialog steps of all named transactions together per instance | |||
| Top N transaction response times sorted by average response time, and sorted by number of steps | |||
| CCMS performance counters | CCMS and CCMS_MONSET Custom Checks | ||
| SAP Instance (Java-only) | Hourly, daily, and monthly | J2EE garbage collection runtime ratio | JVMGarbageCollector Check |
| J2EE DSR average action response time | Average of sum of times (CPU, gen, load, net…) per DSR record with action types unequal to 'unknown' | ||
| J2EE DSR number of actions | |||
| JVM memory used and allocated space | JVM_MEMORY Check | ||
| SAP Instance (Web Dispatcher) | Hourly, daily, and monthly | Number of connections | [WD_ConnectionStat] Check |
| Number of threads | WD_ThreadStat Check | ||
| Number of queues | WD_QueueStat Check | ||
| SAP System (ABAP and ABAP+Java) | Hourly, daily, and monthly | Number of concurrent users | TH_USER_LIST |
| Number of Transports | TMS_ImportStat Check | ||
| Daily and monthly | Average dialog response time and number of dialog steps | Daily Check | |
| Average response time and number of dialog steps for named transactions | |||
| Average response time and number of dialog steps of all named transactions together per system | |||
| Top N transaction response times sorted by average response time, and sorted by number of steps | |||
| Hourly, daily, and monthly | End-to-End ABAP, Java, and HTTP response times | End-to-End Application Monitoring | |
| CCMS performance counters | CCMS and CCMS_MONSET Custom Checks | ||
| Database (All Database types, except MySQL and PostgreSQL) | Hourly, daily, and monthly | Database size and used space | ADA_DATAAREA, DB2_TABLESPACES, MSS_DBUSAGE, SYB_DataSpaces, HDB_Disks, ANY_DBSpaces, SIQ_DataSpaces and ORA_TABLESPACES Checks |
| Database (MaxDB) | Hourly, daily, and monthly | Number of sessions | Count of sessions belonging to connected users |
| Data cache hit ratio | |||
| Catalog cache hit ratio | |||
| Database (Microsoft SQL Server) | Hourly, daily, and monthly | Number of logons | OS Performance value of counter with name 'User Connections' |
| Buffer cache hit ratio | |||
| Lock wait time | |||
| Number of deadlocks | |||
| Database (Oracle) | Hourly, daily, and monthly | Tablespace size and used space | [ORA_TABLESPACES] Check |
| Number of logons | 'logons current' from V$SYSSTAT | ||
| Data buffer hit ratio | |||
| DD cache hit ratio | |||
| User/recursive calls ratio | |||
| Sorts in memory | |||
| Short table scans | |||
| Number of waiting sessions | |||
| Enqueue deadlocks, timeouts, and waits | |||
| Database (DB2) | Hourly, daily, and monthly | Tablespace size and used space | [DB2_TABLESPACES] Check |
| Number of connections | Sum of local and remote connections SNAPDBM | ||
| Buffer pool hit ratio | |||
| Sort overflows % | |||
| LSN gab clean triggers | |||
| Time database waited on locks | |||
| Lock waits | |||
| Deadlocks | |||
| Lock escalations | |||
| Database (SAP HANA) | Hourly, daily, and monthly | Disk size/usage of named volume partition | Performance data tables M_VOLUMES and M_VOLUME_SIZES |
| Physical memory size/usage by host | |||
| Peak memory limit size/usage | |||
| CPU load by host | |||
| Number of total lock waits | |||
| Total lock wait time per server | |||
| Backup Size | |||
| Backup Throughput | |||
| Database (SAP ASE) | Hourly, daily, and monthly | Number of connections | Count of SUIDs in master.sysprocesses |
| Cache hit ratio | |||
| Database (SAP SQL Anywhere) | Hourly, daily, and monthly | Number of connections | ConnCount from sa_db_properties |
| Cache hit ratio | |||
| Checkpoint urgency | |||
| Recovery urgency | |||
| Database (SAP IQ) | Hourly, daily, and monthly | Main Cache Size | [SIQ_Cache] check |
| Temp Cache Size | |||
| Main Cache Used | |||
| Temp Cache Used | |||
| Main Cache Hit Ratio | |||
| Temp Cache Hit Ratio | |||
| Catalog Cache Max Size | |||
| Catalog Cache Used | |||
| Catalog Cache Hit Ratio | |||
| Memory Allocated | |||
| Connections Active | SIQ_Connections check |
Performance Indicators are shown in the UI and reported in the Service Level Reports for those Systems where Performance Data Collection is turned on. This can be turned on or off on a per-System (via PerfDataCollection Monitoring Parameter) level.
Performance Indicators are aggregated automatically into hourly, daily, and monthly values, whereas hourly and daily values are kept for six months and monthly values are kept for three years in Avantra (see also Performance.PERFDATA_KEEPTIME_MONTHLY).
PostgreSQL Database
Avantra allows you to monitor any PostgreSQL as a stand alone database. Similar to other monitored objects, Avantra provides several out of the box checks which are applied to a PostgreSQL monitored object automatically. To understand how to add a PostgreSQL database, please follow the guide covering Adding a standalone Database.
The out of the box checks include:
- PGSQL_Bloat
- PGSQL_Connections
- PGSQL_Deadlocks
- PGSQL_LongTransactions
- PGSQL_ReplicationSlot
- PGSQL_TempFiles
Predictive Analytics
Predictive Analytics is the Avantra Enterprise Edition approach to “spiky”, “bursty”, or “flapping” monitoring situations for checks based on time series data. It combines Machine Learning algorithms to predict future trends with classic threshold based monitoring.
This function is only available with the Avantra Enterprise Edition. For more information about editions please see the Avantra Editions Matrix.
There are situations where thresholds are too static, or become too strict. The intention of thresholds is to define a long term separator between good and not so good. Usually a situation only becomes critical if a threshold is exceeded over a longer period of time. Whenever resource usage is spiky, or there are usage bursts, thresholds can be exceeded for a short period of time, although this does not constitute a critical situation.
From a technical perspective it tricky is to decide: is a certain situation only a usage spike, or is it the beginning of a longer term problem?
Predictive Analytics tries to remediate this dilemma. The Avantra agent applies ML based algorithms to understand usage patterns and to predict - at every given point in time - how the usage will evolve in the near future. These predictions are used to determine a trend whenever the agent evaluates a check. And this trend is taken into account, in addition to the defined thresholds.
If a threshold is exceeded and the predictive analytics engine projects the situation clears again within a short period of time, the check status will not be changed. Only if the situation is projected to get worse the check status is changed immediately.
Staring with Avantra 21.11, the Predictive Analytics Engine is enabled in the CPULOAD and the HDB_CPULoad checks. It will successively be rolled out to other checks based on time series data.
R
RealTime Monitoring
The main purpose of system monitoring is to periodically check the systems' health conditions and to report critical conditions to an administrator immediately. This is what many system monitoring applications do, and so does Avantra. And since this reporting shall happen immediately, we call this kind of monitoring RealTime Monitoring.
Remote Monitoring
Agentless monitoring or Remote Monitoring in Avantra is a powerful way to monitor and manage objects within your landscape where you are unable to install an Avantra Agent on the host in question. This is particularly useful for scenarios such as "Rise with SAP" or "HEC" implementations where the customer (and/or service provider) retain responsibility only for the application layer (client 000 and above). Avantra supports Agentless monitoring for:
- SAP Systems and Instances
- Databases
- Cloud Services
Agentless Monitoring means another agent located close enough from a network perspective will take over the management of the object and will access the monitored components over the network only. The only prerequisite is the Avantra Agent performing Agentless Monitoring is allowed to connect to the SAP Instances and Databases. Please make sure no firewalls on either host or network level are preventing this access.
Route
A Route describes the routing to a set of Avantra Agents and back to Avantra Server. Routes are only used when Avantra Server cannot reach Avantra Agents directly (and/or vice versa).
Technically, a Route consists of a hidden Parameter Set containing two parameters - AgentConnectRoute and MasterConnectRoute - each of which contains a sequence of URLs describing the Route in the direction from Avantra Agents to Avantra Server. The Parameter Set's System Selector specifies the Servers (Avantra Agents) to which the Route shall be applied.
Root Cause Analysis
Usually, Root Cause Analysis, in the context of system monitoring, means finding the most relevant event in a bunch of events, that is, to pinpoint one that causes all other issues.
In Avantra, Root Cause Analysis works somewhat differently. By hierarchical execution of Checks, the potential “Root Causes” are verified first. In case these Checks turn to Critical, all other “dependent” Checks turn to Unknown.
The different system layers
- Physical Server (> Virtual Cluster Server) > SAP Instance > SAP System
or
- Physical Server (> Virtual Cluster Server) > Database (> SAP System)
imply a dependency between the executed checks.
The most basic Check for a Physical Server is the so-called AGENTALIVE Check. It basically verifies if the Avantra Agent itself is operating properly. If this Check fails, the monitoring agent or even the whole server is probably down, or at least unreachable from the network. Consequently, no other Checks can be performed, the Check Results of all Checks executed by this particular agent on this host are considered Unknown (be it Server, SAP Instance, SAP System, or Database Checks).
Similarly, there is an AGENTALIVE Check for Virtual Cluster Servers. If a Virtual Cluster Server is no longer discovered on any Physical Server, no Checks can be performed for applications hosted by this Virtual Cluster Server, so their status is considered Unknown. In addition, the AGENTALIVE Check indicates at Warning level if the Virtual Cluster Server has switched from one Physical Server to another.
At the SAP Instance layer, the RFCCONNECT (ABAP and ABAP+Java) and the J2EECONNECT (Java) Checks play a special role: they verify if the Avantra Agent is able to connect to the SAP Instance. If these Checks fail, the SAP Instance is probably blocked or down. Consequently, no other SAP Instance-specific Checks can be performed, the results of these checks are considered Unknown. In case the RFCCONNECT or J2EECONNECT Check fails for an SAP Instance identified as the “central” SAP Instance, and if no other SAP Instance can play the “central” role, then no (Database-independent) SAP System Check can be performed and results of these Checks are considered Unknown.
At the Database layer, there is the DBCONNECT Check. It verifies if the Avantra Agent is able to connect to the Database. If this Check fails, no other Database (and Database-dependent SAP System) Checks can be performed. Hence the results of these Checks are considered Unknown.
The most important Check for an SAP System is the SystemAlive Check. It's a built-in Composite Check evaluating all the different connect checks for all SAP Instances comprising an SAP System, including the DBCONNECT. In other words, as long as the SystemAlive is Ok, your SAP System is operable, even if one or the other SAP Instance is down. But if it's not Ok, your SAP System is in really bad shape.
S
SAPControl
SAPControl provides a monitoring and management interface for SAP Instances. It can be accessed as a SOAP web service via Named Pipes (Windows), Domain Sockets (Unix), HTTP, or HTTPS. See SAP documentation for more details.
SAPControl User/Password
Credentials needed for access to SAPControl using HTTP/HTTPS protocols. The specified user must be a valid OS user authorized by service/admin_users, service/admin_groups profile parameters, or sapstartsrv executable file permissions (Windows: execute permission, Unix: write permission).
SAP Instance
An SAP Instance is an administrative unit that groups components of an SAP System that provide one or more services, as defined in the SAP Glossary:
Administrative unit that groups components of an SAP system running on one physical host. Application server instances provide the actual computing capabilities of a system and offer corresponding services. Instances are started, stopped, and monitored as one unit. There can be multiple instances (belonging to the same or to different systems) on one host. An instance can be uniquely identified by the host name and a two-digit instance number.
An SAP Instance can be one of the types listed below. An SAP Instance is hosted by exactly one Physical Server or Virtual Cluster Server, but multiple SAP Instances can be hosted on the same server.
If you want to manage or monitor an SAP Instance, you need to manage or monitor the Physical Server or the Virtual Cluster Server that the SAP Instance is hosted on.
Avantra supports the following SAP Instance Types:
| Type | Description |
|---|---|
| Central | An SAP Web Application Server ABAP instance. The one marked as Central by Avantra is usually the primary Application Server as well. The term Central is still used by Avantra to indicate that this is the Application Server where the SAP System related checks are executed. |
| Central+Java | Same as the SAP Web Application Server ABAP CENTRAL instance above, but includes a Java stack as SAP NetWeaver Add-In installation. Central+Java instance types are deprecated by SAP. It is recommended to run separate ABAP or Java systems. |
| Dialog | An instance of an SAP Web Application Server ABAP that is not the central instance |
| Dialog+Java | An instance of an SAP NetWeaver Add-In installation with ABAP and Java stack that is not the central instance. |
| Java | An instance of an SAP Web Application Server Java. |
| Java_Scs | A (Java) SAP Central Services instance. |
| Abap_Scs | An ABAP SAP Central Services instance. |
| Trex | A TREX engine. |
| Web Dispatcher | An SAP Web Dispatcher instance. |
| Abap_Scs with Web Dispatcher | An ABAP SAP Central Services with integrated Web Dispatcher. |
| Enqueue Replication Server | An Enqueue Replication Server. |
In addition to these terms we also use the following grouping terms:
| Grouping | Description |
|---|---|
| ABAP or ABAP-only instance | An instance of type Central or Dialog or Abap_Scs. |
| ABAP+Java instance | An instance of type Central+Java or Dialog+Java. |
| Java or Java-only instance | An instance of type Java or Java_Scs. |
For those SAP Systems that do not have a primary application server (i.e. a classical Central SAP Instance), Avantra chooses one to be considered central. This SAP Instance is performing the monitoring of the SAP System. It is flagged with a ![]() icon.
icon.
SAP System
An SAP System comprises one or several SAP Instances and a Database. It corresponds to SAP products like SAP R/3, SAP R/3 Enterprise, SAP NetWeaver, SAP S/4 HANA, etc.
In terms of SAP, the instances of an SAP System share the same SID (SAP system ID).
In Avantra terms, an SAP System is uniquely identified by the so-called Unified SAP SID. By convention, the Unified SAP SID consists of the SAP System Identifier (SID) with a prefix or suffix to make the Unified SAP SID unique within Avantra installation. In order to avoid confusion, we use the term Real SAP SID to refer to the SID within Avantra.
If you want to manage or monitor an SAP System, you need to manage or monitor the Physical Server, the Database, the primary application server (in old terminology, the Central instance), and, possibly, additional SAP Instances comprising the whole SAP System.
From a license perspective, you need at least an SAP System license and usually a Physical Server as well. If you have additional SAP Instances, you need additional SAP Instance licenses.
Trex and Web Dispatcher SAP Systems only consist of an SAP Instance without a Database, and hence only need an SAP Instance license.
SAP System - Supported Basis Releases
The Avantra Agent monitors the following SAP Basis Releases:
- Releases 4.6C, 4.6D
- Release 6.40
- Releases 7.0x, 7.1x, 7.2x, 7.3x, 7.4x, 7.5x, 7.7.x
Unicode Kernels are supported as well.
SAP System Users (required by Avantra)
The Avantra Agent requires credentials of the SAP System users in order to connect to the SAP Instances.
- ABAP (or ABAP+Java) SAP System
Requires an RFC user with the ZAVANTR role (as created by the transport requests shipped with Avantra), and we recommend creating a dedicated user, for example, avantra_rfc. This user is also called the Avantra RFC User. For the logon client of the user you should consider the following rules:- For ABAP+Java SAP System using the SAP Java User Management Engine (UME), the user has to be created in the main client used by UME in order to enable it for monitoring of the Java stack.
- If you monitor an SAP BI/BW system, you need to create the user in the standard client of the BI/BW system.
- If you monitor an SAP PI/XI system, you need to create the user in the productive client of the PI/XI system.
- Otherwise, we recommend using client 000
- For an ABAP+Java SAP System, we recommend authorizing the Avantra RFC User as an administrator in the Java stack: Assign the ABAP role SAP_J2EE_ADMIN to the Avantra RFC User.
- If you monitor an SAP PI/XI system, also assign the ABAP role SAP_XI_MONITOR to the Avantra RFC User.
- Java-only SAP System
The Avantra Agent requires an administrator user. We recommend creating the avantra_j2ee user and assigning the Administrator role to it. This user is also called the Avantra J2EE User. - Trex and a Web Dispatcher SAP System
There are no users required.
In order to access the Database instance of an SAP System, Avantra Agent also needs the credentials of the ABAP schema user and/or the Java schema user.
Server
Either a Physical Server or a Virtual Cluster Server.
A Physical Server in terms of Avantra is either:
- a real server that runs a copy of the supported operating systems
- a system virtual machine (or hardware virtual machine) running its own operating system (the so-called guest operating sy- tem)
a partition in operating system-level virtualization (virtual environment, virtual private server, guest, zone, container, jail, etc.).
In other words, if it looks like a real server from the point of view of its users, it's called a Physical Server in Avantra.
If you want to manage or monitor a Physical Server you need to install an Avantra Agent on it.The same holds true if you want to define an End Point on it.
In Avantra, a Physical Server refers to anything that has an operating system installed and running an Avantra Agent. In the Cloud context, these are usually “instances” or “virtual machines”.
For VMware, installations on ESXi servers are supported as well as the cloud offerings VMware Engine on GCP and VMware Cloud on AWS. Even if installations on ESXi are not strictly cloud resources, Avantra handles them in the same way.
Avantra automatically detects if it's running in a Cloud Server. If so, and if Cloud Authentication is configured properly, you can start and stop Cloud Servers from the UI, within Maintenance Windows, and using Notifications.
Service Authentication
In case Avantra detects a Cloud Server, it needs to access the API of the corresponding cloud provider in order to provide automation options, e.g. to stop and start these Cloud Servers. For VMware, the API is provided by the VMware vCenter managing the virtual machines in question.
Service Hours
Service Hours in Avantra define certain parts of the week, like 24x7 or from 8 am to 6 pm every working day, etc.
They can be used in Service Level Agreements, Filters, and Parameter Sets.
Service Level Agreement
You can define Service Level Agreements and assign the agreements to servers and/or SAP Systems. A Service Level Agreement primarily consists of a definition of Service Hours and a Committed Availability Rate.
For Systems having a Service Level Agreement assigned, the Service Level Report generation process considers Availability Data within the Service Hours (instead of the default 7x24) and compares the computed availability rate with the Committed Availability Rate.
For Service Level Agreements, you can also choose whether the Service Hours are defined in local system time or in UTC. If they are in local system time, then each of the System's TimeZone settings is considered to compute the availability rate.
Maintaining Service Level Agreements
In Avantra, Service Level Agreements are strongly related to availability data. Usually, in the Service Level Reports the System's availability rates are calculated based on 7x24 time ranges.
Within Service Level Agreements you can define Service Hours. Once a Service Level Agreement is assigned to a certain System, this System's availability rate is calculated with respect to the defined Service Hours. Each Service Hours record itself consists of a single or multiple Time Ranges defining one or more time slices on one or more days of the week.
To create a Service Level Agreement, you need to define Service Hours (or select one of the pre-defined ones), and in order to define Service Hours, you need to define Time Ranges.
For a Service Level Agreement, you can decide if the attached Service Hours are meant to be in UTC or in local time. If they are meant to be in UTC, all System's availability rates (of the Systems having the Service Level Agreement assigned) are computed based on UTC times. Otherwise, for each System, its TimeZone information is considered for availability rate computation.
If there is no TimeZone defined for a particular Server or SAP System, the TimeZone value of the Customer owning the System is considered. If this one is set neither, the local timezone of Avantra WebUI is taken into account.
Further, a Service Level Agreement requires the definition of the Committed Availability Rate. In the Service Level Reports, the System's availability rate will be reported against exactly this value.
To view Service Level Agreements, you need the View SLA Permission. In order to create, modify, or delete Service Level Agreements, Service Hours, Time Ranges, and in order to view all defined Service Hours you need the Edit SLA Permission.
Creating a Service Level Agreement
To create a new Service Level Agreement, perform the following steps:
- Select Reporting > Service Level Agreements from the top-level menu. Choose New from the toolbar.
- Fill in Name and click New.
- Fill in an optional Description and define the percentage (without the % sign) for the Committed Avail.~Rate.
- Select a value from the Service Hours list.
- If you want the Service Hours to be treated as UTC time, flag the UTC check box.
- Click Apply.
Assign a Service Level Agreement
Finally, you need to assign the defined Service Level Agreement to some Systems, either Servers, SAP Systems, Databases or a combination of these:
- Choose Systems > SAP Systems, or Systems > SAP Instances, or Systems > Databases, or Systems > Servers, or Systems > SAP BusinessObjects, or Systems > Cloud Services from the top-level menu.
- Select the list items and choose More > Assign SLA.
- Select the appropriate Service Level Agreement and click Assign.
Service Level Report
You can easily generate a Service Level Report for each Customer. If, for example, you schedule the Service Level Report generation at the beginning of each month, your Customers can easily download the monthly reports. But you can also generate the Service Level Reports manually using Avantra WebUI in order to select content, reporting period, etc.
Service Level Reports can be customized. It is possible to change language, colors, fonts, page size, images, etc. to suit your specific needs and requirements.
All Service Level Reports are generated in PDF format and stored in the Avantra Database. Service Level Reports are generated automatically based on a schedule and can be sent to email addresses.
Generating Service Level Reports
In Avantra WebUI, Service Level Reports can be generated manually or automatically based on a schedule.
Click Reporting > Service Level Reports from the top-level menu to create and manage Service Level Reports. There are five tabs:
- Reports: use this tab to view and create Service Level Reports.
- Templates: use this tab to manage Service Level Report templates. Templates are used to define generation settings that can be reused.
- Remarks: use this tab to create Service Level Report remarks. Remarks are special comments which are inserted into Service Level Reports.
- Styles: use this tab to create Service Level Report styles. Styles are used to customize the layout of the generated Service Level Report.
- Jobs: use this tab to administrate Service Level Report jobs. Jobs trigger the automated generation of Service Level Reports.
Generating Service Level Reports ad-hoc
Select the first Report tab. You can find the following actions:
- Click New to create a new Service Level Report. A template can be selected which provides default settings. The Service Level Report generation dialog opens where the content of the Service Level Report can be defined. See below for more details about generation.
- Press Show to view a Service Level Report
- Press Generate Again to create a Service Level Report again. This is only available for unpublished Service Level Reports. Generating a Service Level Report again is useful in case you want to do some modifications.
- Press Publish to publish a Service Level Report. Only published Service Level Reports are visible to other users. Unpublished Service Level Reports are only visible to the user who created the Service Level Report.
- Press Rename to rename a Service Level Report.
- Press Delete to delete a Service Level Report.
The Service Level Report generation dialog provides the following configuration options:
| Customer | Define the customer to include in the Service Level Report. You can select the Include sub customers checkbox to include also the sub customers. Only systems which belong to this customer can be included in this report. |
| Select Systems | To include all systems from the selected customer select the radio button All systems. To include only systems with a specific system role, select Select by System Role. Select Advanced Selection to define a specific selection of systems to include in the report. |
| Time Period | This can be either the previous month, or any other month in the past, or an arbitrarily defined period in time. Choose Last Month, Select Month, Select Month(s), or Select Day and make further selections accordingly. |
| Remark | Include the remarks defined for this customer in the report. See below. |
| Summary of Availabilities | Include a chapter with a summary of system availabilities. Select the checkboxes to exactly define what to include in the report. |
| Business Services | Include a chapter about Business Services. |
| Servers | Include a chapter about the monitored servers. You have several checkboxes to define which collected data to include. |
| SAP Systems | Include a chapter about the monitored SAP Systems. You have several checkboxes to define which collected data to include. |
| Databases | Include a chapter about the monitored Databases. You have several checkboxes to define which collected data to include. |
| Changes | Include a chapter about the system changes. You have several checkboxes to define which data to include. |
| RealTime Monitoring | Include a chapter with RealTime Monitoring check results. You can include All RTM Checks or a selection, which is the recommended approach. |
Please be aware that this option will always report the latest RealTime Monitoring results, no matter which Time period you choose for other data. This is indicated by a timestamp in the RealTime Monitoring section of the Service Level Report.
You may use the option Group checks by check name to report a sub-section for each check name. Otherwise, it will be a single section with all checks being sorted alphabetically.
| Daily Checks | Include a chapter with the daily check results. You have the option to include all daily check results, daily checks which have a specific status, or only daily checks for a specific check type. |
| Customer Users | Include a chapter with all users who have access to this customer. |
| Tickets | Include a chapter with the tickets which have been opened, worked on, or closed within the given time period. |
| Hide table of content | Select the checkbox to exclude the table of content. If you want to include only some levels of the table of content, select the checkbox and set the number of levels to include. |
| Ignore downtimes if less than | In order to avoid very short Downtimes being shown in the availability statistics, you may select this checkbox. Downtimes less than the defined number of minutes are ignored and considered as uptime. |
| Group systems by application type | Select this option to create chapters for each application type. This will introduce an additional level in the table of content. |
| Exclude performance data for days which are not covered by SLA | By default, all collected performance data is used for the report. Select this checkbox if you only want to include performance data that was collected when an SLA is defined and active. |
| Don't show forecast for performance charts | By default, the reported data is extrapolated into the future for those types of resources where it's useful. The extrapolation is suppressed if you set this flag. |
| Rename document | You have the option to define a name for the generated report. |
| Publish SLR automatically after generation | Select this checkbox to publish the report. If the report is not published, the report is not visible to other users, only the user who created the report can view see the report. It is not recommended to publish a report during testing and fine-tuning. |
Published reports are stored in the Avantra database. Unpublished reports are stored in the file system.
| Apply style | Select a style to apply to the report. Styles can be defined in the Styles tab, see below. |
Once you configured what to include in the report, press Generate SLR. If you did not set all mandatory settings, a message indicating the reason is shown. If all mandatory settings are set, the Generating SLR dialog is opened which shows you the progress of the generation. During generation, you have the option to stop the generation, or you can send the generation to the background. Sending a generation to the background closes the generation dialog and you can continue to work in Avantra WebUI. You will find the report after a time in the Reports tab. Once the report is generated you have the option to view the report, press Close and open SLR.
You need the Generate SLRs Permission in order to generate Service Level Reports.
Generating Service Level Report templates
Service Level Report templates define a set of settings used to generate a Service Level Report. Typical settings are the customer, the monitored systems to include, which performance data to include, and many more. It is highly recommended to create a set of templates that can be used to create a Service Level Report. Templates are also used for the automated generation of Service Level Reports.
Select the second Templates tab.
You can find the following actions:
- Press New to create a new template. After setting a name for the template, a dialog to define the template settings is opened. The template can be saved to be used later for Service Level Report generation.
- Press Open to view or edit a template.
- Press Copy to copy a template and give a new name.
- Press Delete to delete a template.
The Service Level Report template dialog is the same as the Generate SLR dialog with two more form fields. You have the option to set a name for the template and a Shared checkbox that indicates whether this template is shared or not. Shared templates are visible and useable by other users. Templates which are not shared are only visible by the user who created the template. Templates must not contain all mandatory fields which are required to create a Service Level Report. If you later select the template to create the report, you must set the remaining mandatory fields.
You need the Edit SLR Templates Permission in order to create, modify, and delete Service Level Report Templates.
Managing Service Level Report Remarks
The intended use for SLR Remarks is to include customized free text messages in Service Level Reports. Assume you have had a special incident during the reporting period that is supposed to be part of the Service Level Report.
There is a default SLR Remark assigned to all customers. This remark can be modified, and — of course — you can select if it will be included in the Service Level Report during the generation process. The default SLR Remark cannot be deleted.
You may also define new SLR Remark records, but at most one per customer. If there is a customer assigned SLR Remark (and you choose to include SLR Remarks during Service Level Report generation), this one will be included instead of the global one.
- Press New to create a new remark.
- Press Open to view or edit a remark.
- Press Delete to delete a remark.
You need the Edit SLR Remarks Permission in order to create, modify, and delete Service Level Report Templates.
Managing Service Level Report Styles
Service Level Report styles can be used to customize a Service Level Report. Avantra provides a default style, but if you want to change colors, fonts, images, and more, you can do so with styles.
In the Service Level Report generation dialog, a style can be selected.
- Press New to create a new style.
- Press Open to view or edit a style.
- Press Delete to delete a style.
You do not have to define all available style settings in the style definition dialog. Only define the settings where you want to modify the default settings. Settings that are not changed in a style will always use the built-in default styles. Styles have no influence on the content and data in the report.
You must have either the Administrator Role or the Super Administrator Role assigned in order to manage Service Level Report Styles.
Managing Service Level Report Jobs
Service Level Report jobs are used to automate the creation of Service Level Reports.
A Service Level Report job is based on a schedule that defined when to create the report and a template that defines what to include in the report.
- Press New to create a new job.
- Press Open to view or edit a job.
- Press Delete to delete a job.
SLR Jobs are configured in the SLR Job Details dialog. The following options can be set:
| Active | Select this checkbox to actually execute the job based on the schedule. SLR jobs that are not active are not executed. |
| Name | Set a name for the job. |
| SLR Template | Select the template which defines the content and data to include in the report. Make sure that the template contains all mandatory settings. If the template does not contain all mandatory settings, the job cannot create the Service Level Report. |
| Customer | Set the customer (or override the customer from the template) to be used in the report. |
| Schedule | Click Edit to define a schedule when the job runs and create the Service Level Report. |
| Last | Select the number of months, weeks, or days to include in the report. |
A time period in the SLR template is ignored from the SLR job.
An SLR job will always calculate a new time period based on the current execution time. For example: if you want to create a Service Level Report on the 2nd day of the month which includes data from the previous month, then create a schedule, select Monthly, select Day, and choose 2. For Last type 1 and select months.
| Publish | Check to publish the Service Level Report into the database and to make it visible to other users. |
| Copy to folder | Check to copy the generated report to the specified folder. Please make sure that Avantra has write permission on this folder. You can use macros (%%CUSTOMER%, %%YEAR%%, %%MONTH%%, %%DAY%%) for the folder. Avantra will create that folder if it does not exist. |
| Send Email | Check Send Email to send the Service Level Report to an email receiver. Set the following email options. The Service Level Report will be inserted as an attachment to the email. |
- From email address which is used as sender.
- To email address which defines the recipient.
- CC / BCC email address which defines CC and BCC recipients.
- Subject the email subject.
- Body the email body.
You must have either the Administrator Role or the Super Administrator Role assigned in order to manage Service Level Report Jobs.
To define mail settings for your automatic reports, navigate to Administration > Settings > Avantra Master and verify the following fields: Mail.from, Mail.host, Mail.password, Mail.port, and Mail.user. In case your outgoing email server requires additional encryption, please also set the value for the fields Mail.ssl, Mail.ssl-port, Mail.tls.
Solution Documents
The idea of solution documents is to provide functions to document all kinds of things in the area of system management.
Probably, the most important, but not limited to, is the option to create documents describing problem resolution and to easily find the most appropriate solution document once you face the same class of problems. It is exactly this purpose giving the function its name. More generally you can provide solution documents for the following objects within Avantra: RealTime Monitoring, Daily Checks, Systems, Parameter Sets, Custom Checks, Maintenance Windows, Customers, and Changes.
A solution document can be written using the built-in editor WYSIWYG HTML-Editor. In addition, you can attach any existing document, or you can simply provide an external link to refer to any other document you may have in place already.
Every solution document may have the so-called references. These references may be used to link the solution documents to the objects mentioned above. However, the references do not imply direct links between solution documents and other objects, but they reflect a relationship between the two, and the number and types of references indicate how relevant a certain solution document is for a given object.
In other words, if you search for solution documents, you will find multiple results with the most relevant solution documents at the top of the results, as known from other search engines.
Solution documents are always assigned to a specific customer. This way, solution documents have access control since documents can only be viewed by users who have the necessary permissions for this customer. If you want to create a solution document that users of other customers can read, you should create a role for a generic customer and assign this role to the users who should be able to read the given document.
System
In Avantra terms a system is one of the following system types:
- Physical Server
- Virtual Cluster Server
- SAP Instance
- SAP System
- Database
- SAP Business Object
- Cloud Service
As a synonym, we also use the term Monitored System. Every system is “owned” by a customer.
Basically, if you want to manage or monitor a physical server, you need to install Avantra Agent on top of it. The same holds true if you want to perform End-to-End Application Monitoring: for every End Point you need to install Avantra Agent.
If you want to monitor a Virtual Cluster Server, you have to install Avantra Agent on all physical servers that may host the Virtual Cluster Server.
If you want to monitor an SAP Instance, you need to install Avantra Agent on the physical server hosting the SAP Instance, or on all physical servers a Virtual Cluster Server may run on hosting the SAP Instance. The [Auto Discovery] functions will automatically find all hosted SAP Instances.
If you want to monitor a Database — either an SAP Database instance or a standalone Database — you need to install Avantra Agent on the physical server hosting the Database, or on all physical servers a Virtual Cluster Server may run on hosting the Database.
Of course, you need only a single Avantra Agent monitoring the physical server itself, any Virtual Cluster Server configured on top of it, and all the SAP Instances or Databases installed on either the physical server or the Virtual Cluster Server. This Avantra Agent may as well serve as an End Point in End-to-End Application Monitoring.
If you want to manage an SAP System, you need to install Avantra Agent on all physical servers hosting SAP Instances (either directly or via Virtual Cluster Servers) of the particular SAP Systems, and on all physical servers hosting SAP Database instances (either directly or via Virtual Cluster Servers).
Due to the [Auto Discovery] algorithm, the SAP Instances hosted on a Server running Avantra Agent are automatically detected in almost all cases.
System Change Auto Detection
Avantra provides a built-in Change Management solution allowing Customers to request changes on their Systems. Many of the System changes are recorded automatically using System Change Auto Detection.
System Role
System Role is one of the attributes and a standard grouping mechanism every system in Avantra has. Default System Roles are Production, Test, Quality assurance, Development, Sandpit, Integration, Education, and Consolidation.
Other System Roles can be defined as well.
System Selector
System Selector is a user interface element to define a Dynamic Group or Static Group of Systems for use in Parameters Sets, Custom Checks, Composite Checks, and Business Services.
The group can be defined either by attributes of the corresponding System Type (like described in Dynamic Group) or by further restriction to hosted or hosting Systems according to the following paths:
- Server → Database or Server → SAP Instance → SAP System
- SAP Instance → SAP System or SAP Instance → Server → Database
- SAP System → SAP Instance → Server → Database
- Database → Server → SAP Instance → SAP System
This allows subtle selections, like returning all productive SAP Systems that have a Java SAP Instance. You can even exclude particular Systems from the selection.
System Selectors can be defined ad-hoc, in which case they are only available for the CustomCheck, Composite Check, etc. they are defined for. Or they can be defined generically, in which case they can be shared across multiple objects.
System Status
Every System has a so-called System Status. The System Status is defined as follows:
- For a Server it's the Check Status of the AGENTALIVE Check.
- For an SAP Instance the System Status depends on the Instance Type:
- For an ABAP-only SAP Instance it's the Check Status of the RFCCONNECT Check.
- For a Java-only SAP Instance it's the Check Status of the J2EECONNECT Check.
- For an ABAP+Java SAP Instance it's the worse of the Check Status of the J2EECONNECT and the RFCCONNECT Checks.
- For an Abap_Scs SAP Instance it's the Check Status of the ASCS_MSGSRV Check.
- For a Java_Scs SAP Instance it's the Check Status of the SCS_MSGSRV Check.
- For a Trex SAP Instance it's the Check Status of the TREX Connect Check.
- For a Web Dispatcher SAP Instance it's the Check Status of the WD_Connect Check.
- For an SAP System it's the Check Status of the SystemAlive Check.
- For a standalone Database it's the Check Status of the DBCONNECT Check.
T
Tunnel
A tunnel in Avantra is used when a connection between two Gateways is only possible in one direction, that is when Gateway A can connect to Gateway B but Gateway B cannot connect to Gateway A.
Technically, Gateway A keeps alive a connection to Gateway B, which allows Gateway B to send data to Gateway A without actually having to establish a connection to Gateway A.
A Gateway in this scenario can be Avantra Agent or Avantra Server.
Trend Analysis
Avantra uses intelligent objects monitoring. It watches for critical trends rather than for single events. A single shortdump in an SAP System is not considered critical. A certain number of shortdumps over a given period of time is indeed considered critical. We call this Trend Analysis, and it greatly reduces the number of false alerts.
U
User Management
Users in Avantra can represent natural persons (or also technical accounts).
Having Service Providers on one side and Customers on the other side basically implies two classes of Users: one class representing the Service Provider, the other class representing Customers.
These classes of Users will have different Roles indicating their type of business. Roles basically contain a set of permissions, and they link these permissions to one or more Users on one hand, and to one or more Customers on the other hand. Therefore Customers are the smallest entity that permissions can be assigned to. In addition, there are also permissions that are not based on a certain customer but assigned to all customers in an Avantra environment, like the permission to define a Monitoring Parameter Set.
Permissions are inherited automatically in case a Customer hierarchy is defined. Permissions assigned to the Root Customer are inherited from all Customers. In addition to linking Roles directly to Users, they can also be linked to Groups of Users. In other words, Avantra uses a role-based access control scheme.
If you do not want to assign a User to a Customer using Roles, you can assign it directly. In this case, permissions will be assigned by means of a Permission Set. A Permission Set basically is a Role that implicitly contains the Customer the User is assigned directly to. Permission Sets allow the Service Provider to delegate User Management to their Customers.
User Authentication is based on User IDs and passwords, and a Password Policy can be enforced. This policy may define a minimum password length, an expiration period, a minimum number of special characters, and so on.
V
Virtual Cluster Server
A resource group in terms of High-Availability cluster environments uniquely identified by a virtual IP address. A Virtual Cluster Server (VCS) may switch between different Physical Servers.
If you want to manage or monitor a Virtual Cluster Server you need to install Avantra Agent on every(!) Physical Server the Virtual Cluster Server may run on.